
Lunar Paper
English
Applications / Data and reporting

Data Hub

Data Hub brings databases, cloud warehouses, files, web APIs and internal records into one governed layer, where teams can preview sources, define relationships, build reusable views and control freshness so every application works from consistent, trusted data.

Highlights · 01

Visual saved-view builder

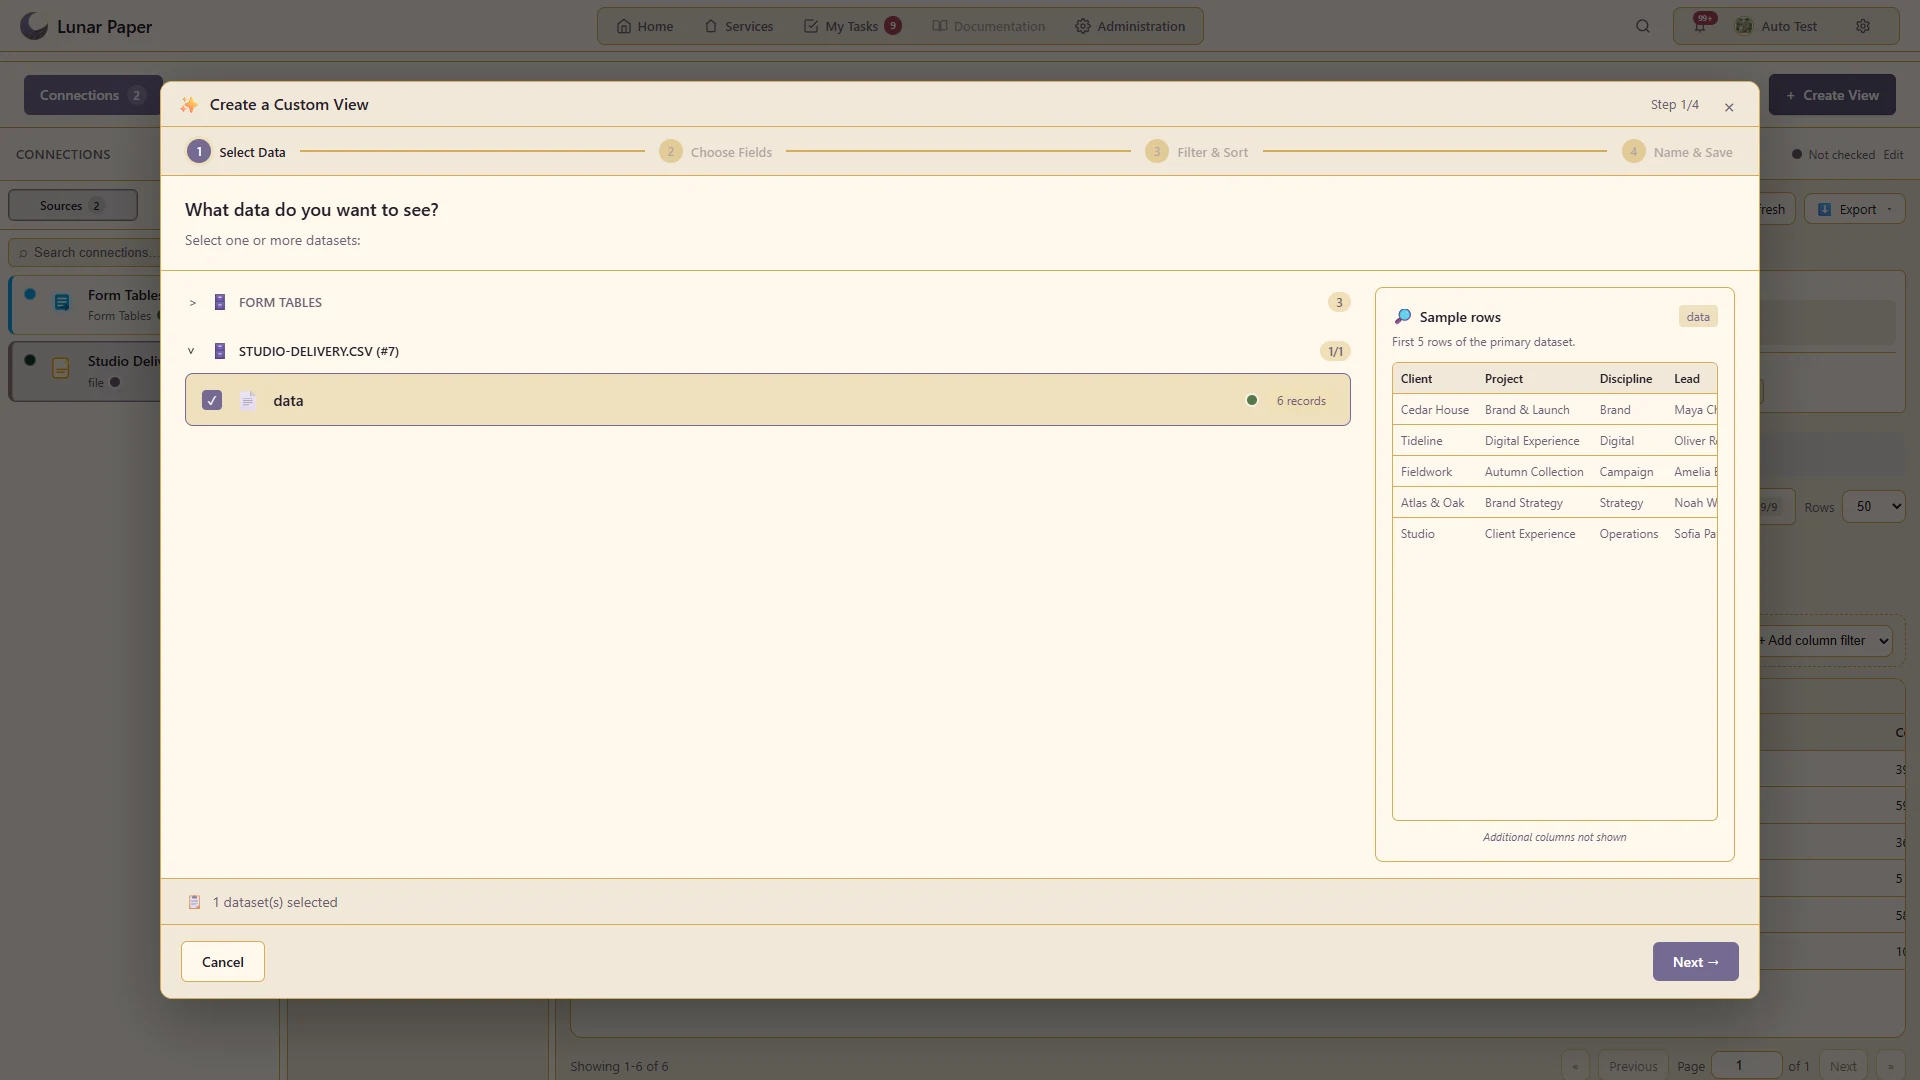
Select data, choose fields, add filters and save a reusable business view.

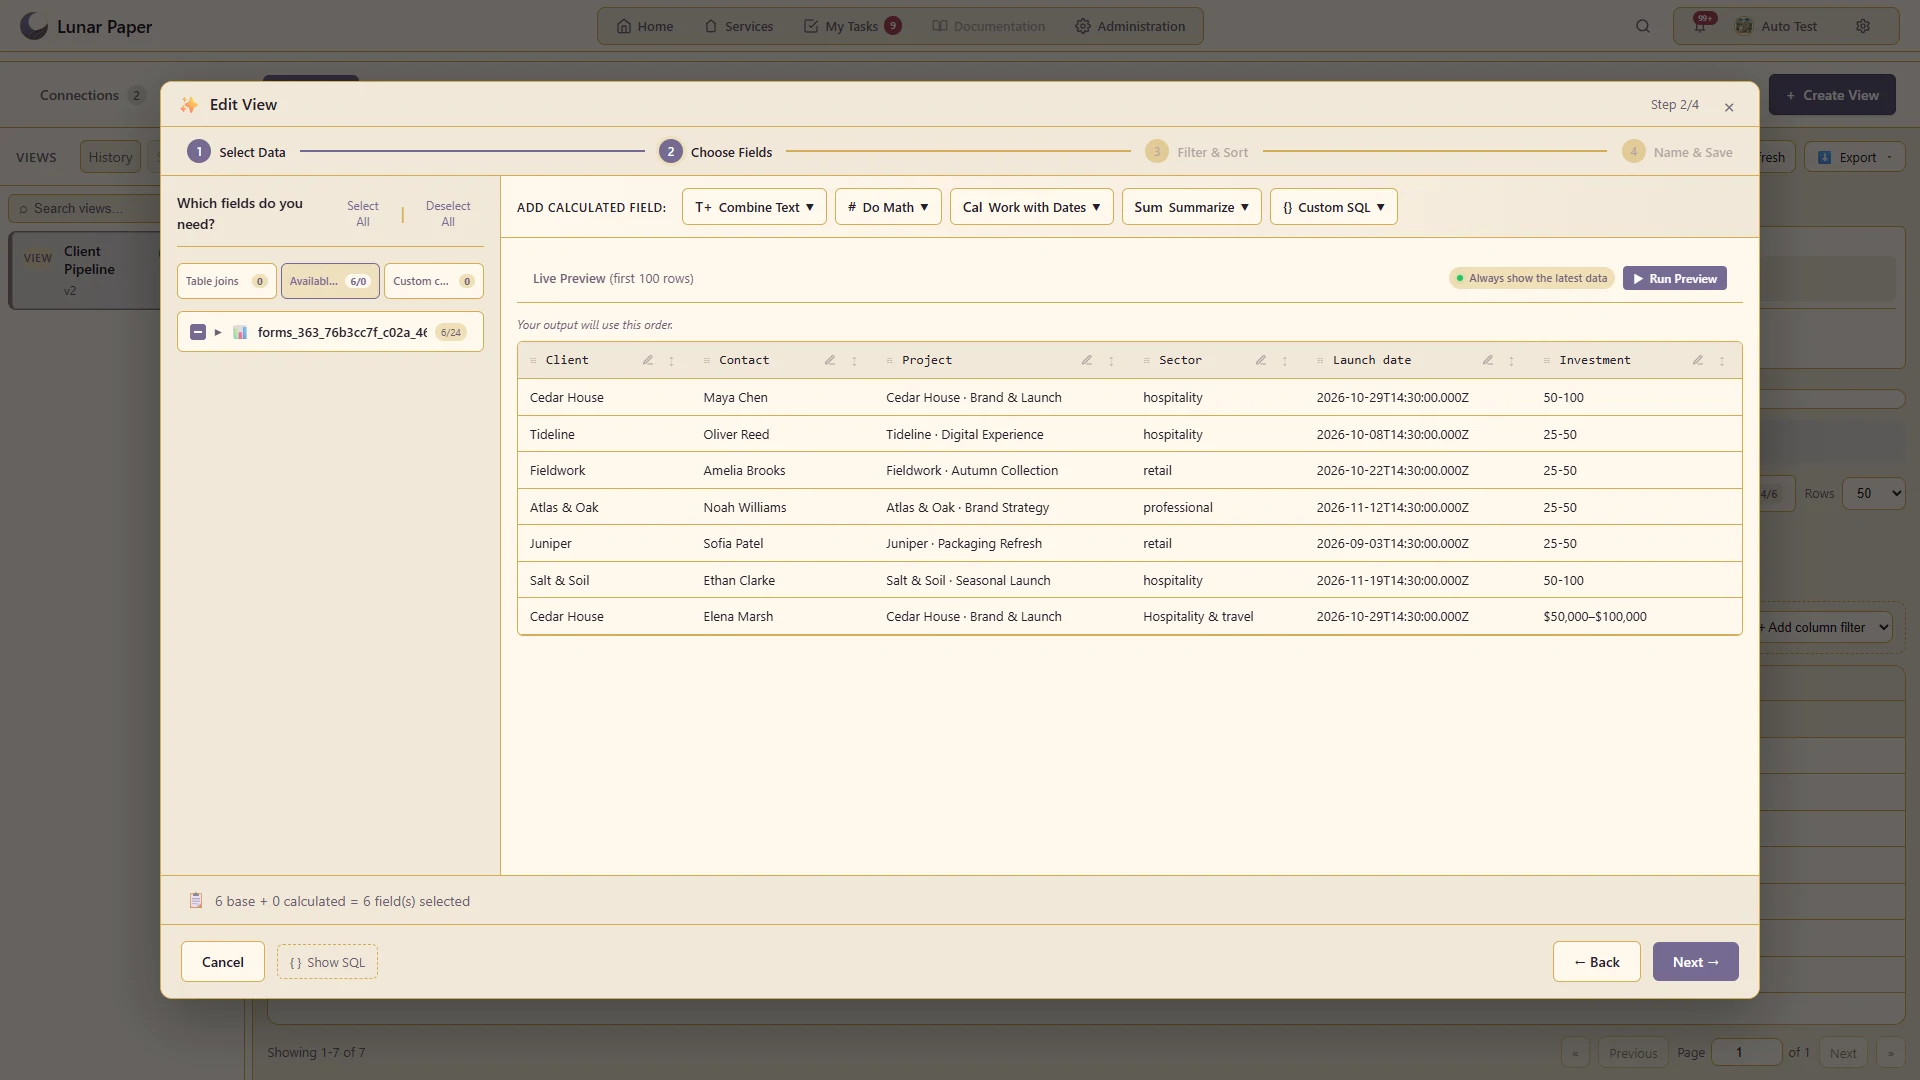
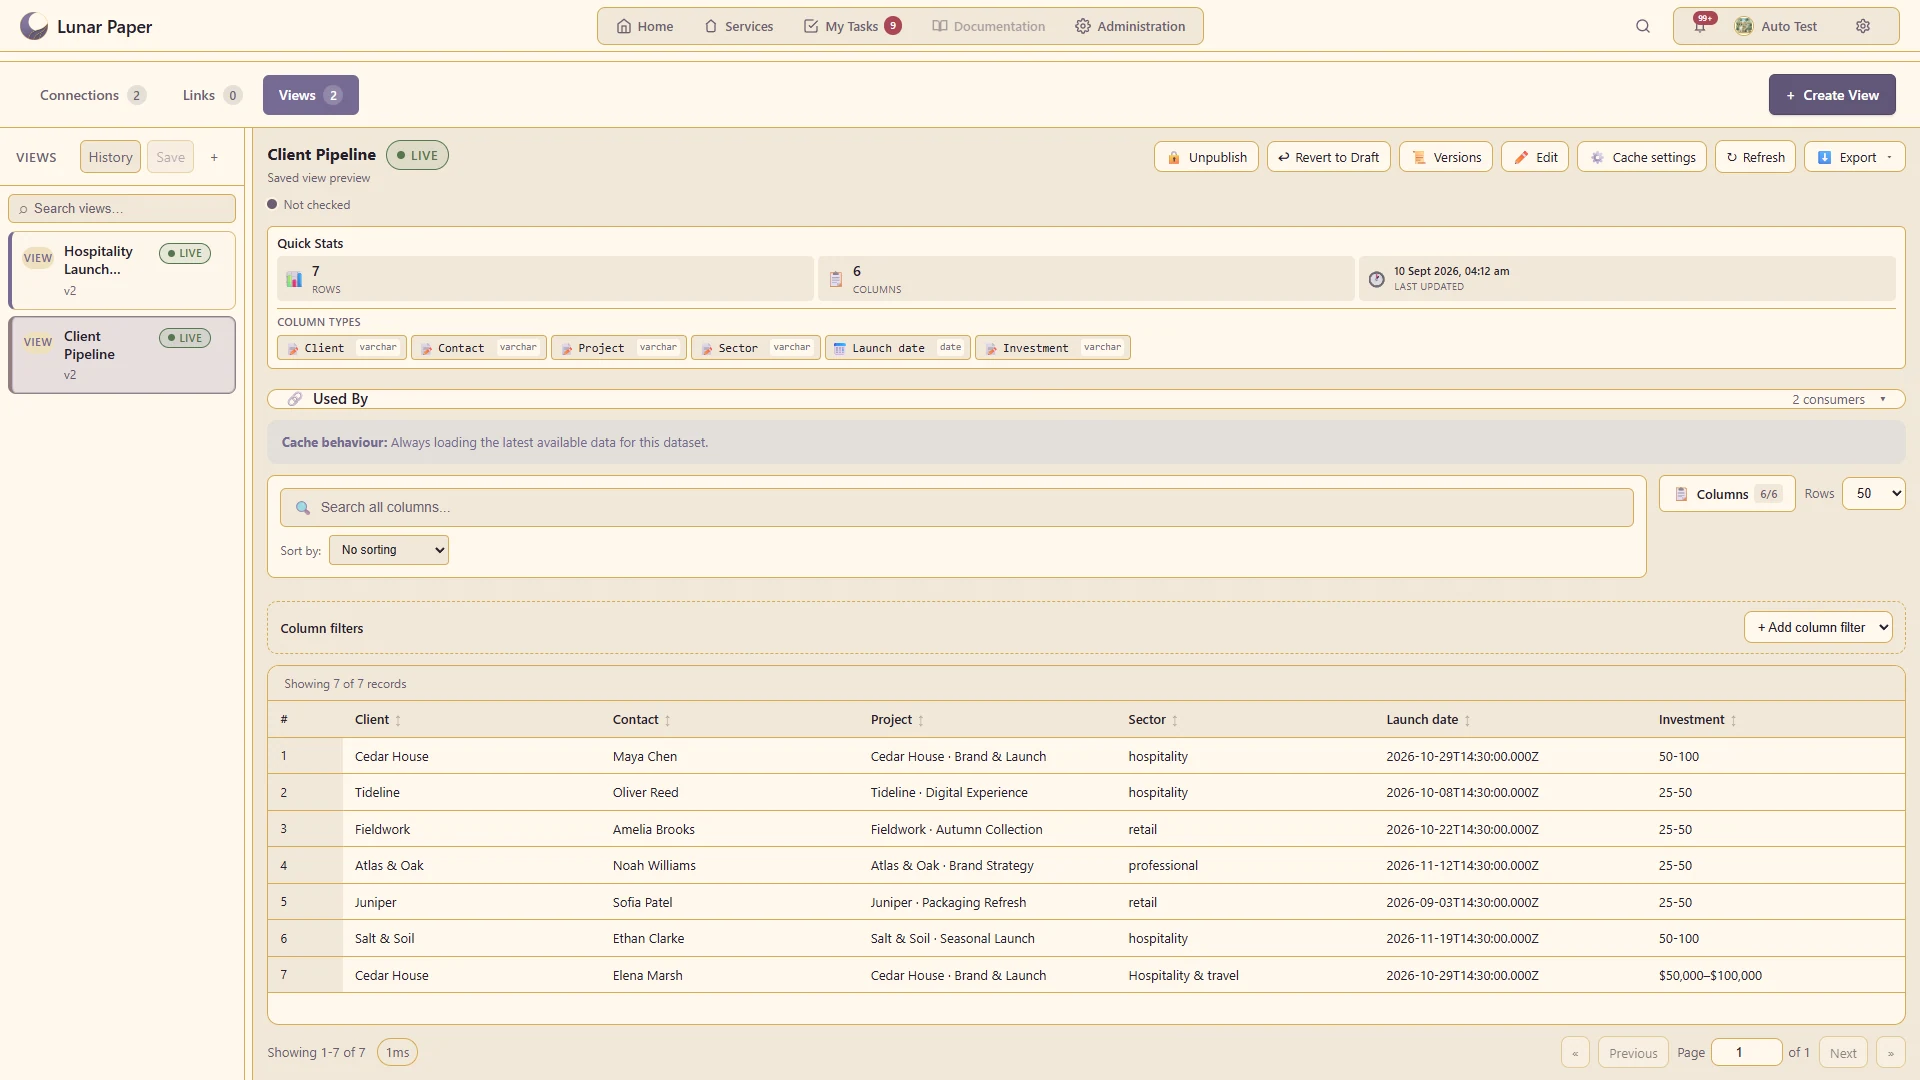
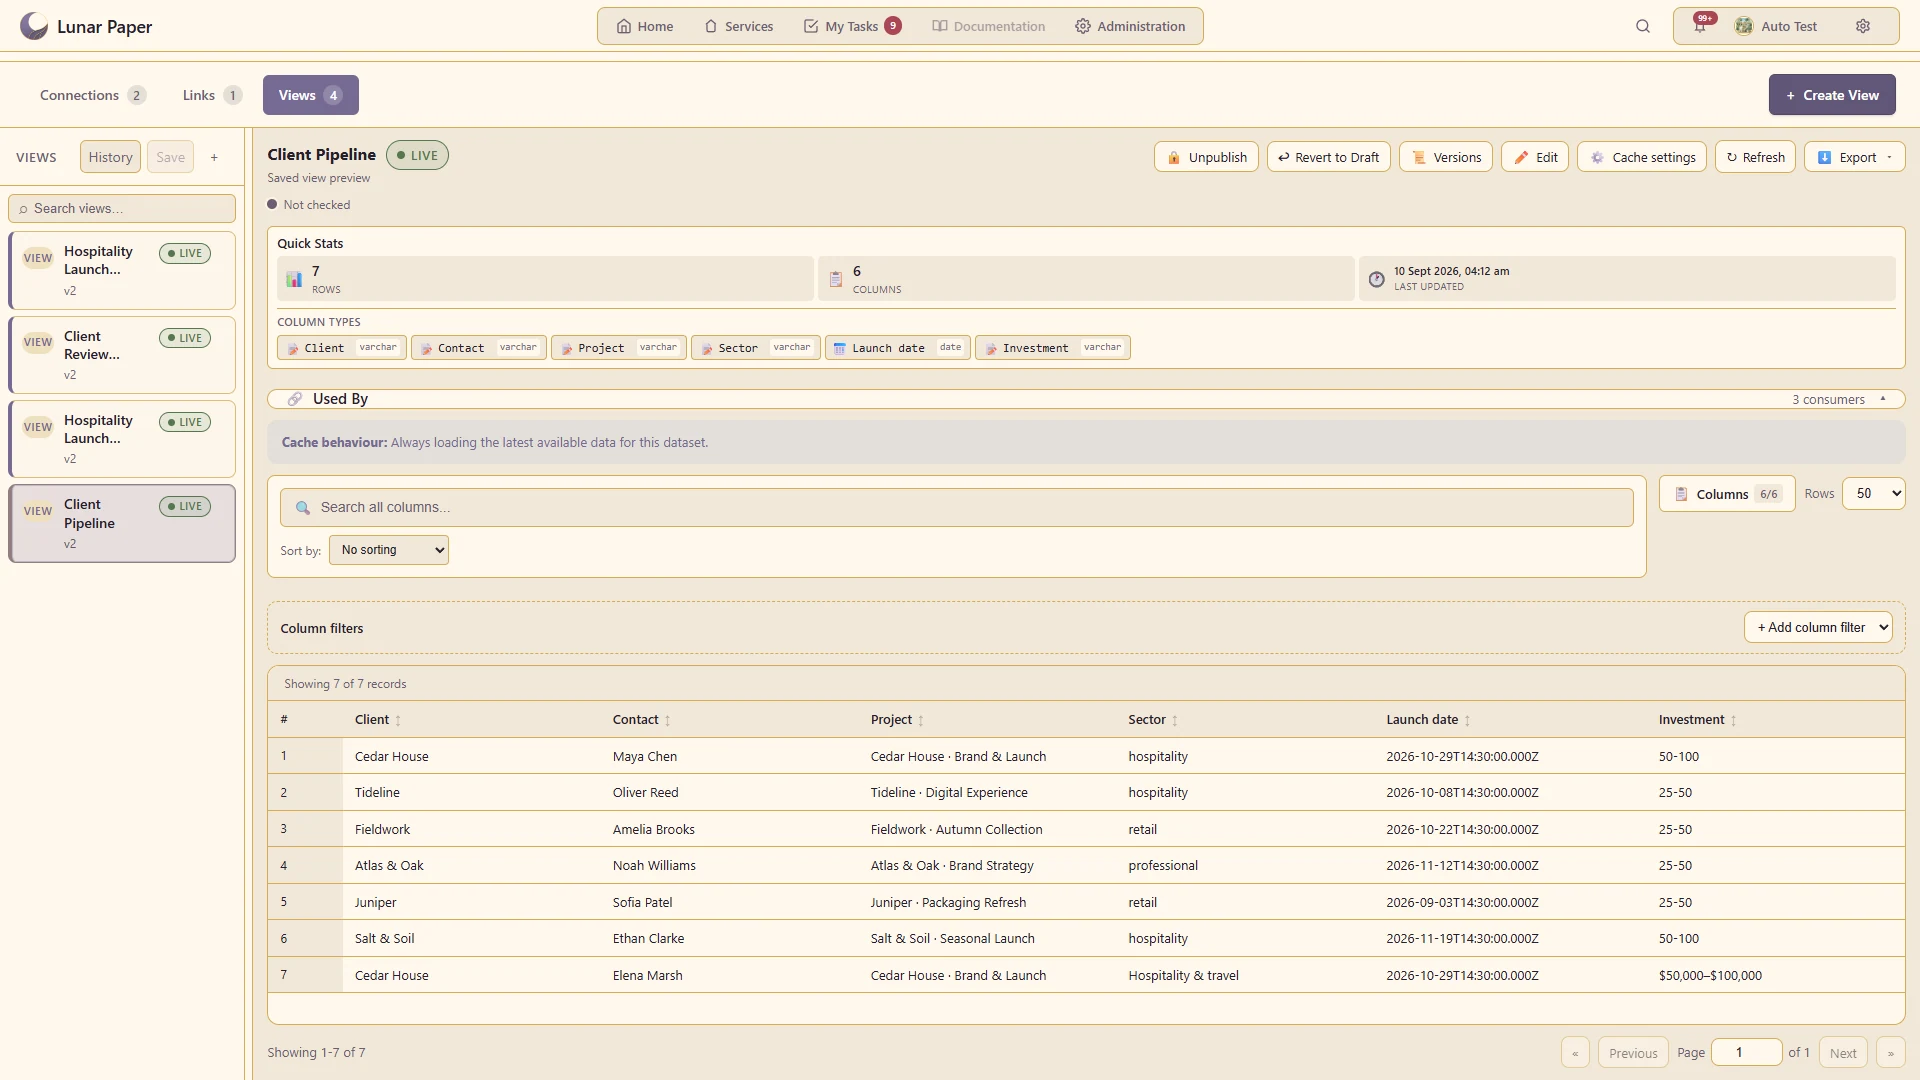
Build a client pipeline with meaningful column names and a live preview of the records that will feed studio reports.
Highlights · 02

Relationships and joins

Connect related records and show the useful combined result.

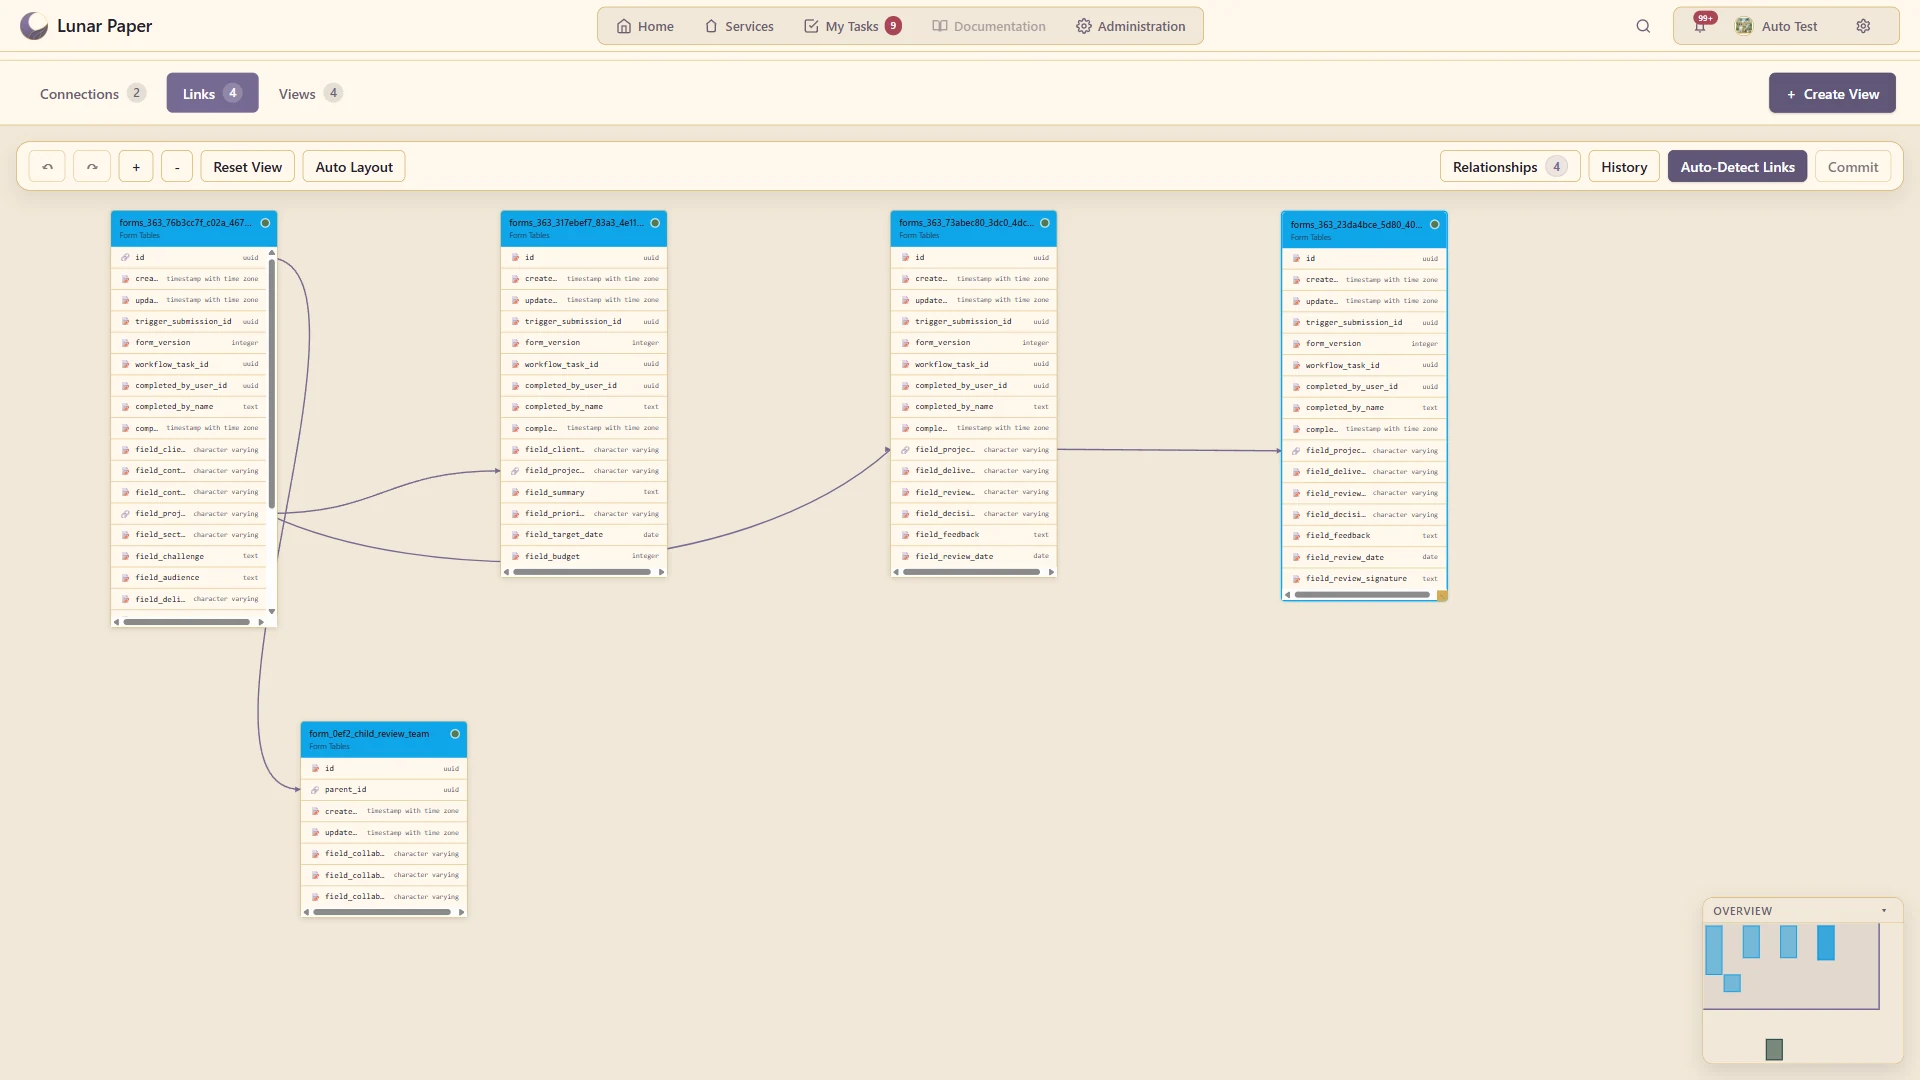
Model five connected delivery tables and their field-level relationships on the ERD canvas.
Highlights · 03

Calculated fields

Build a new business measure from source values with a formula and preview.

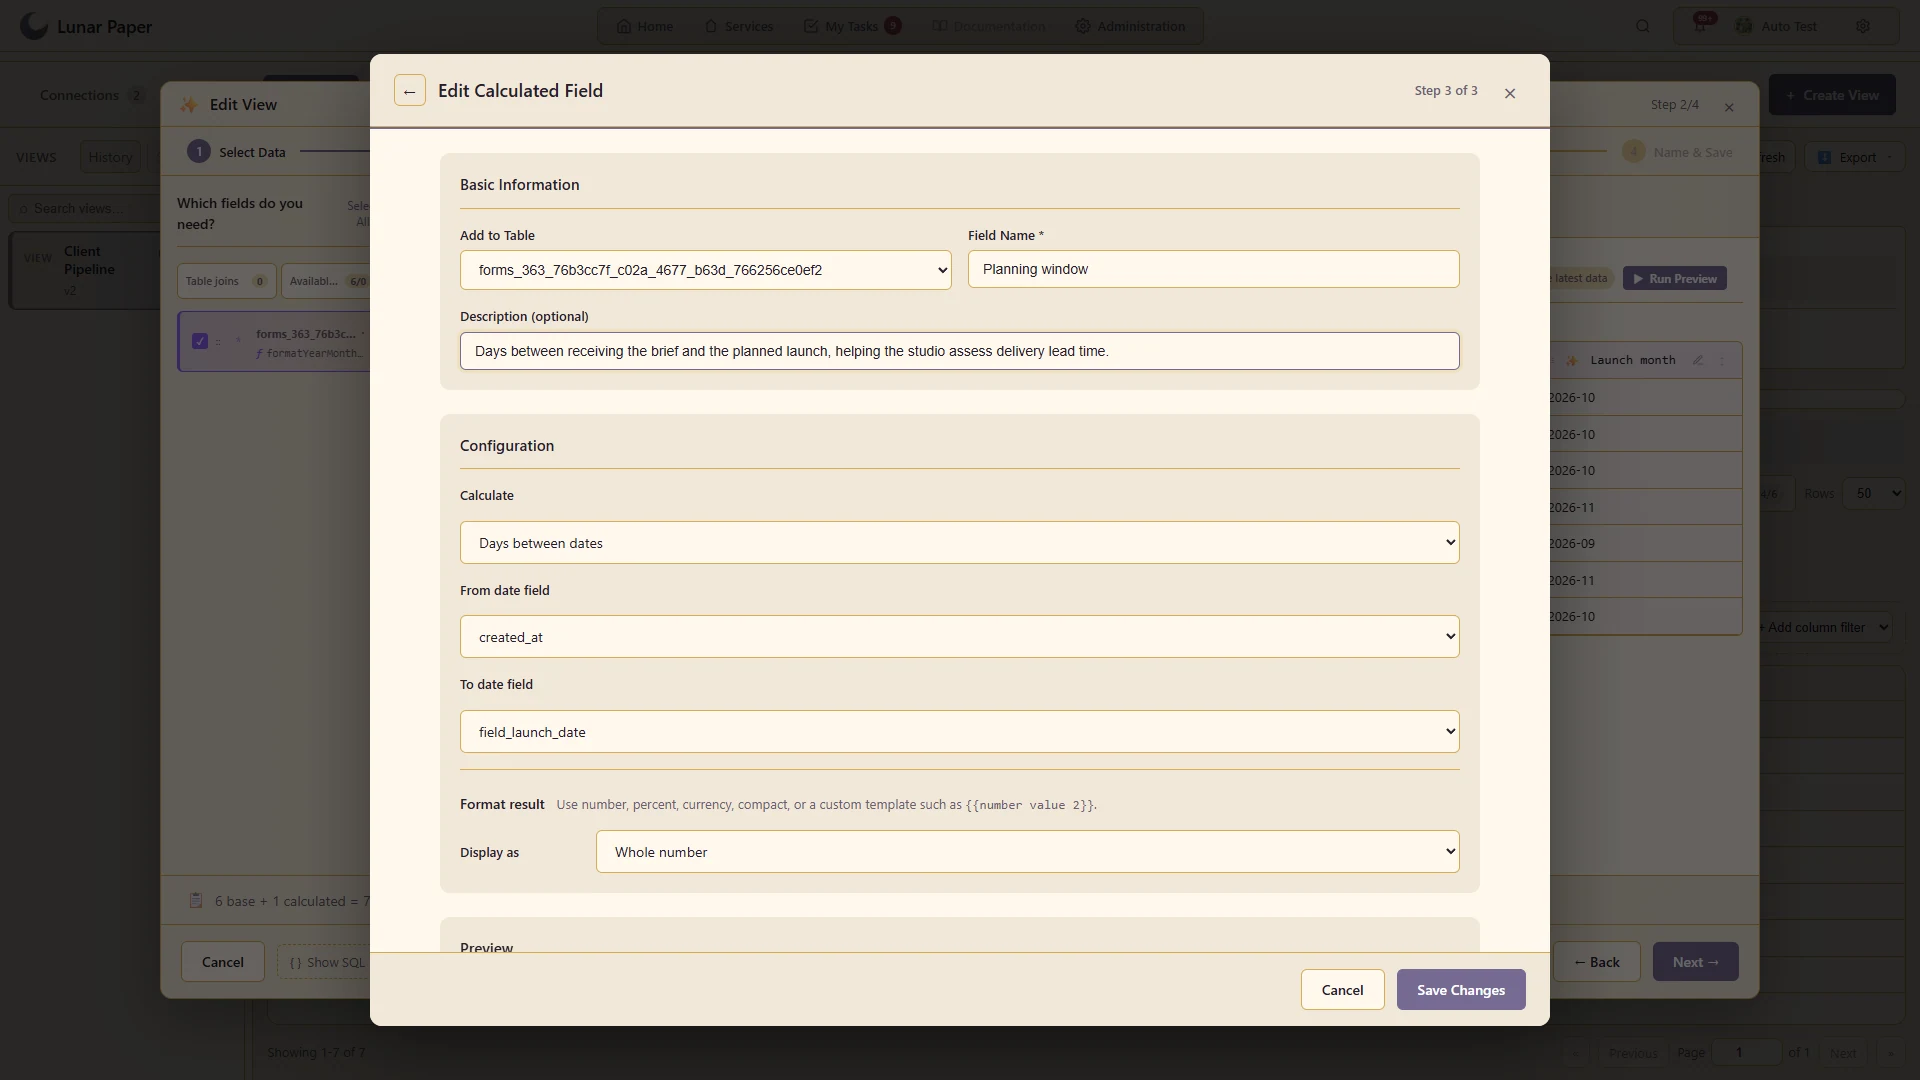
Calculate the planning window between brief receipt and launch, and present the result as whole days.
Highlights · 04

Reuse across applications

Use one saved view in a dashboard, document and workflow.

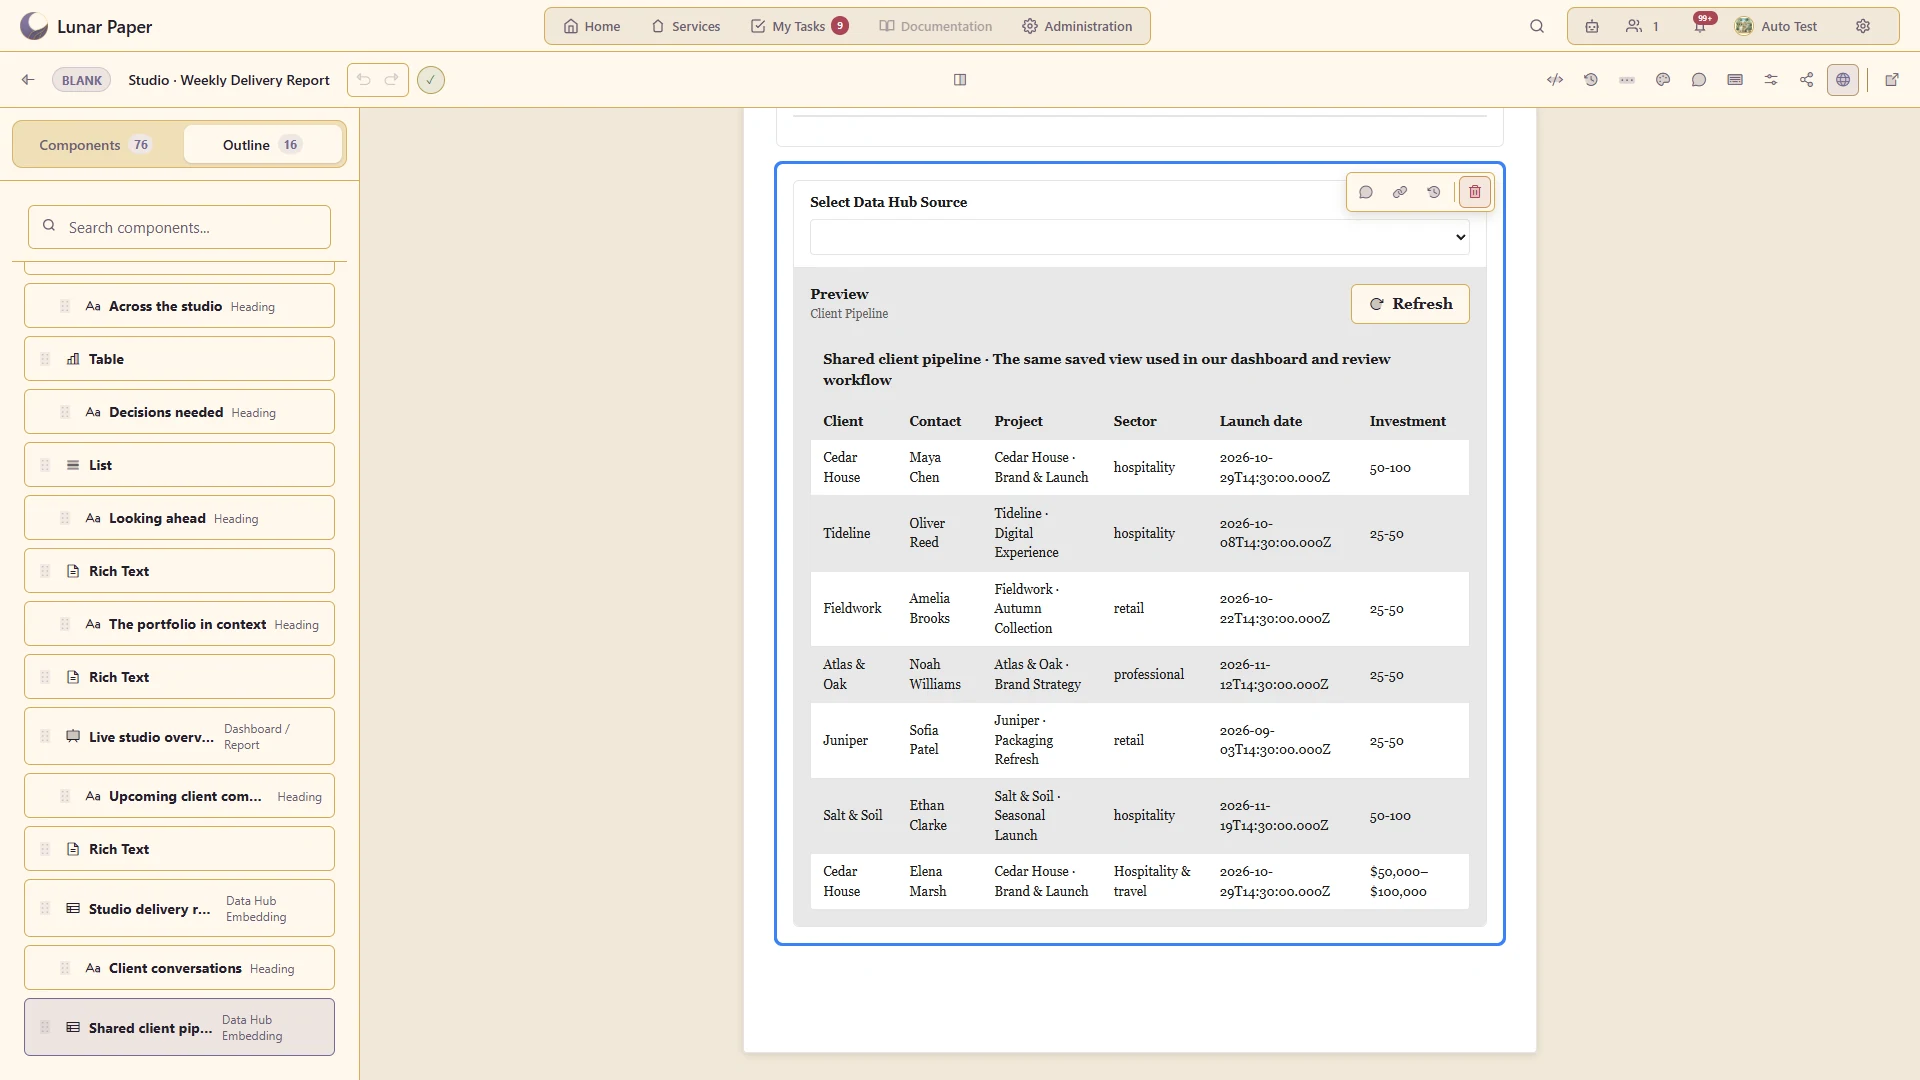
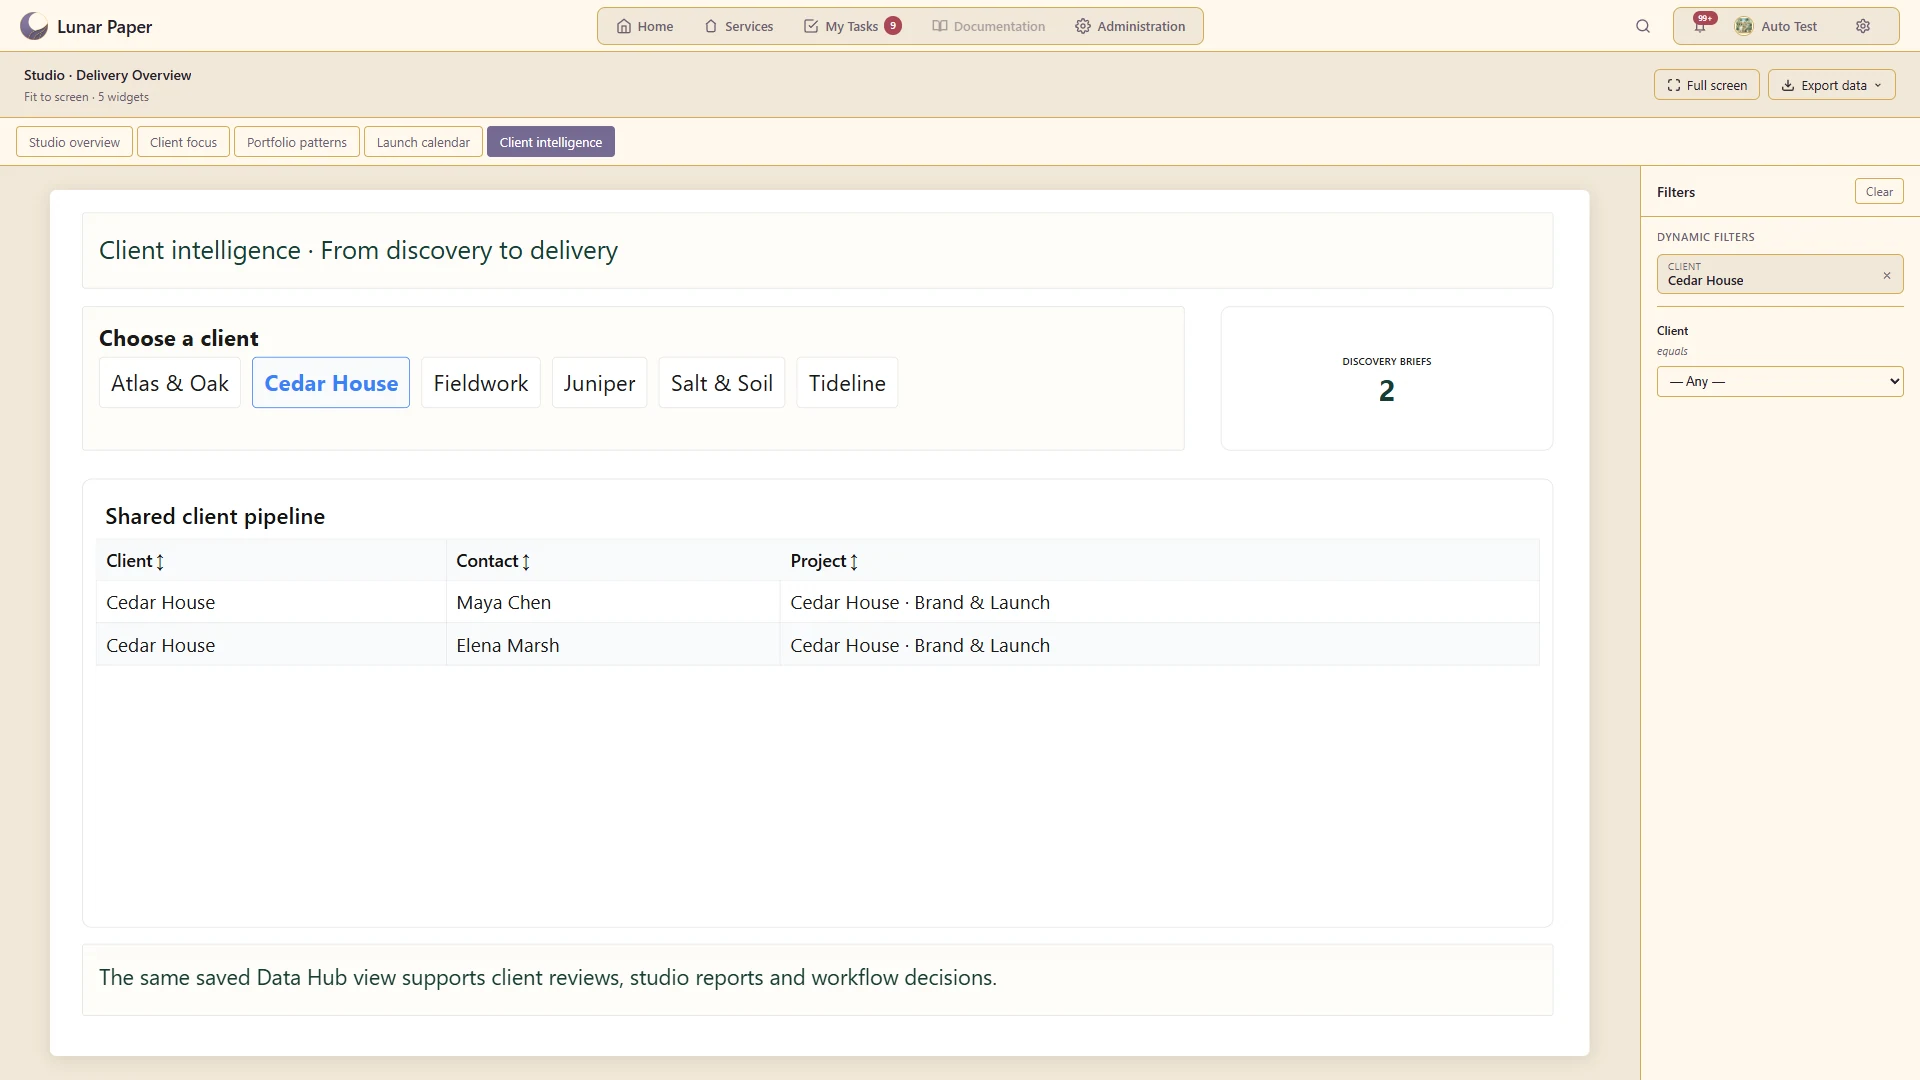
Reuse the same Client Pipeline view in the weekly document, client-intelligence dashboard and studio workflow.
Highlights · 05

Connection catalogue

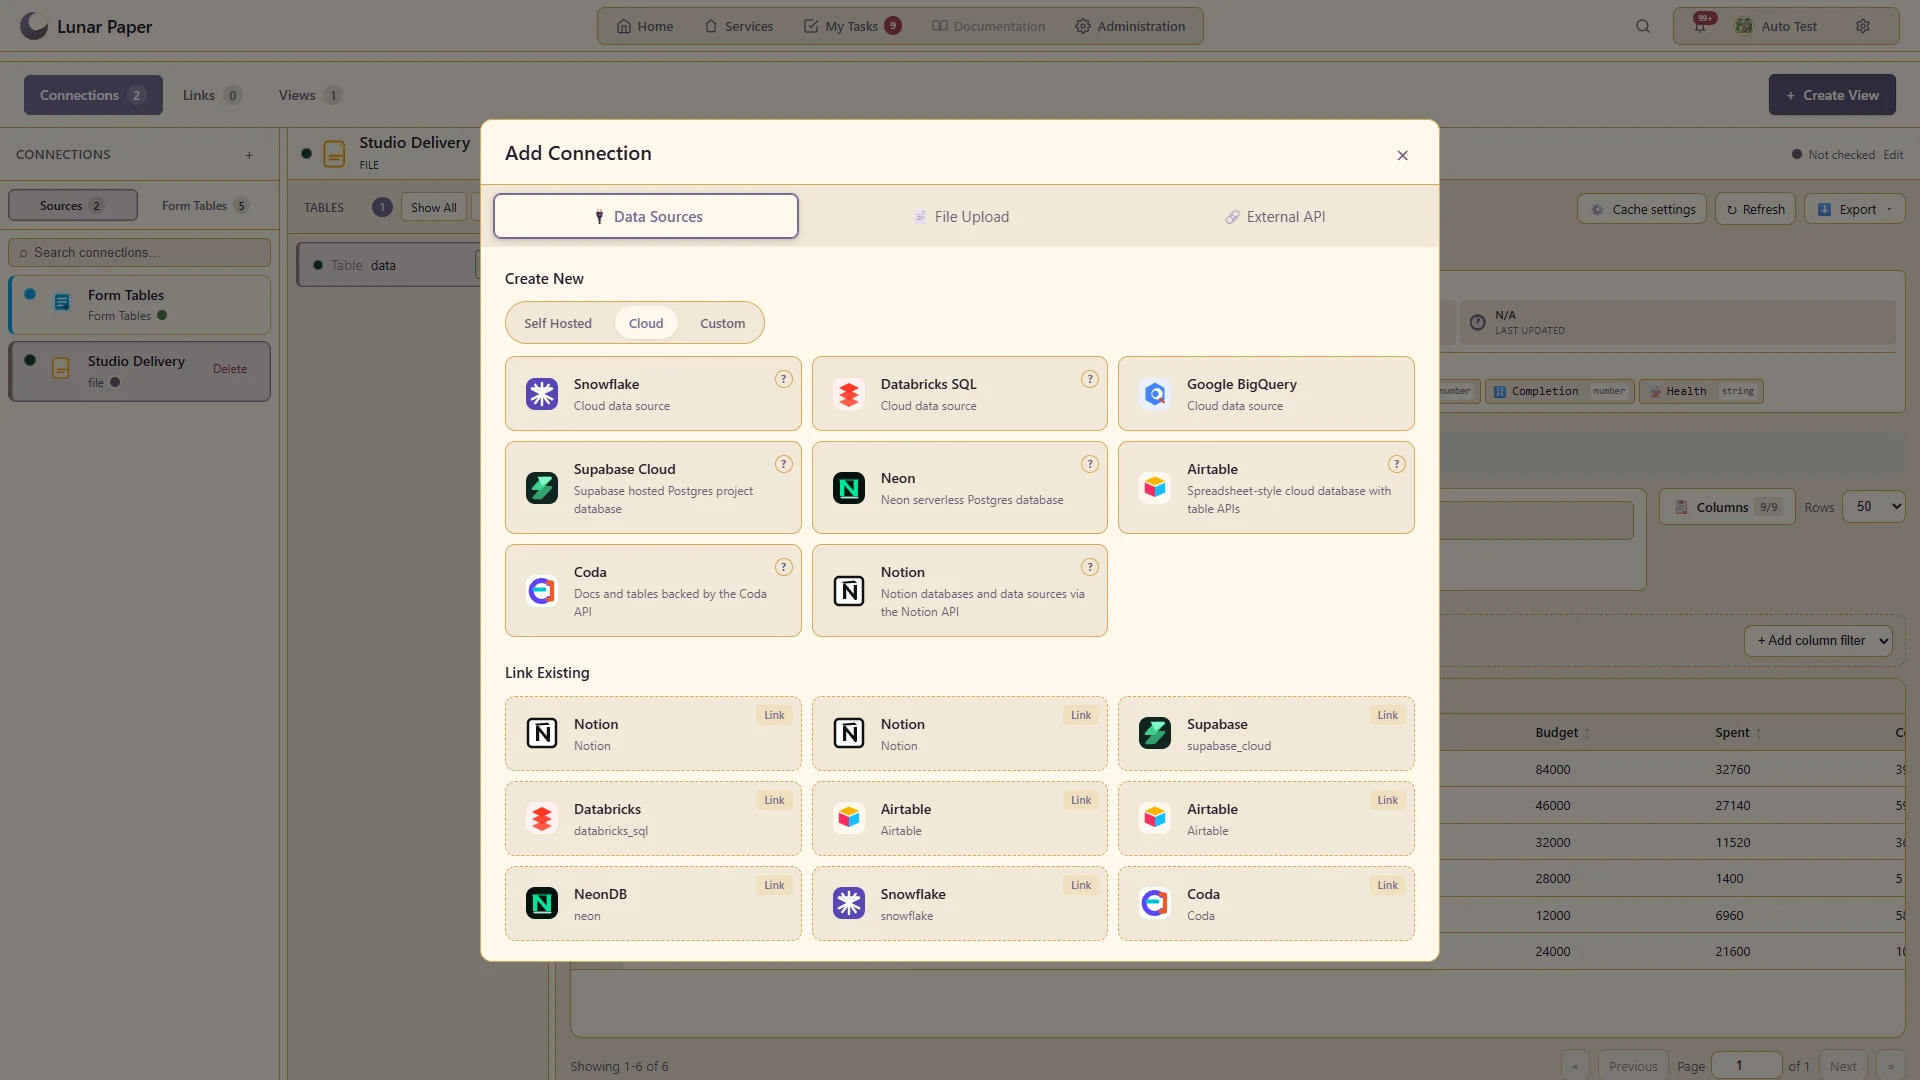
Show the supported database, file and API connection choices with an actual configured source.

Choose a cloud database or API-backed source while retaining the studio’s uploaded delivery data in the same Data Hub.

A closer look

06 — 20
A closer look · 06

Uploaded file data

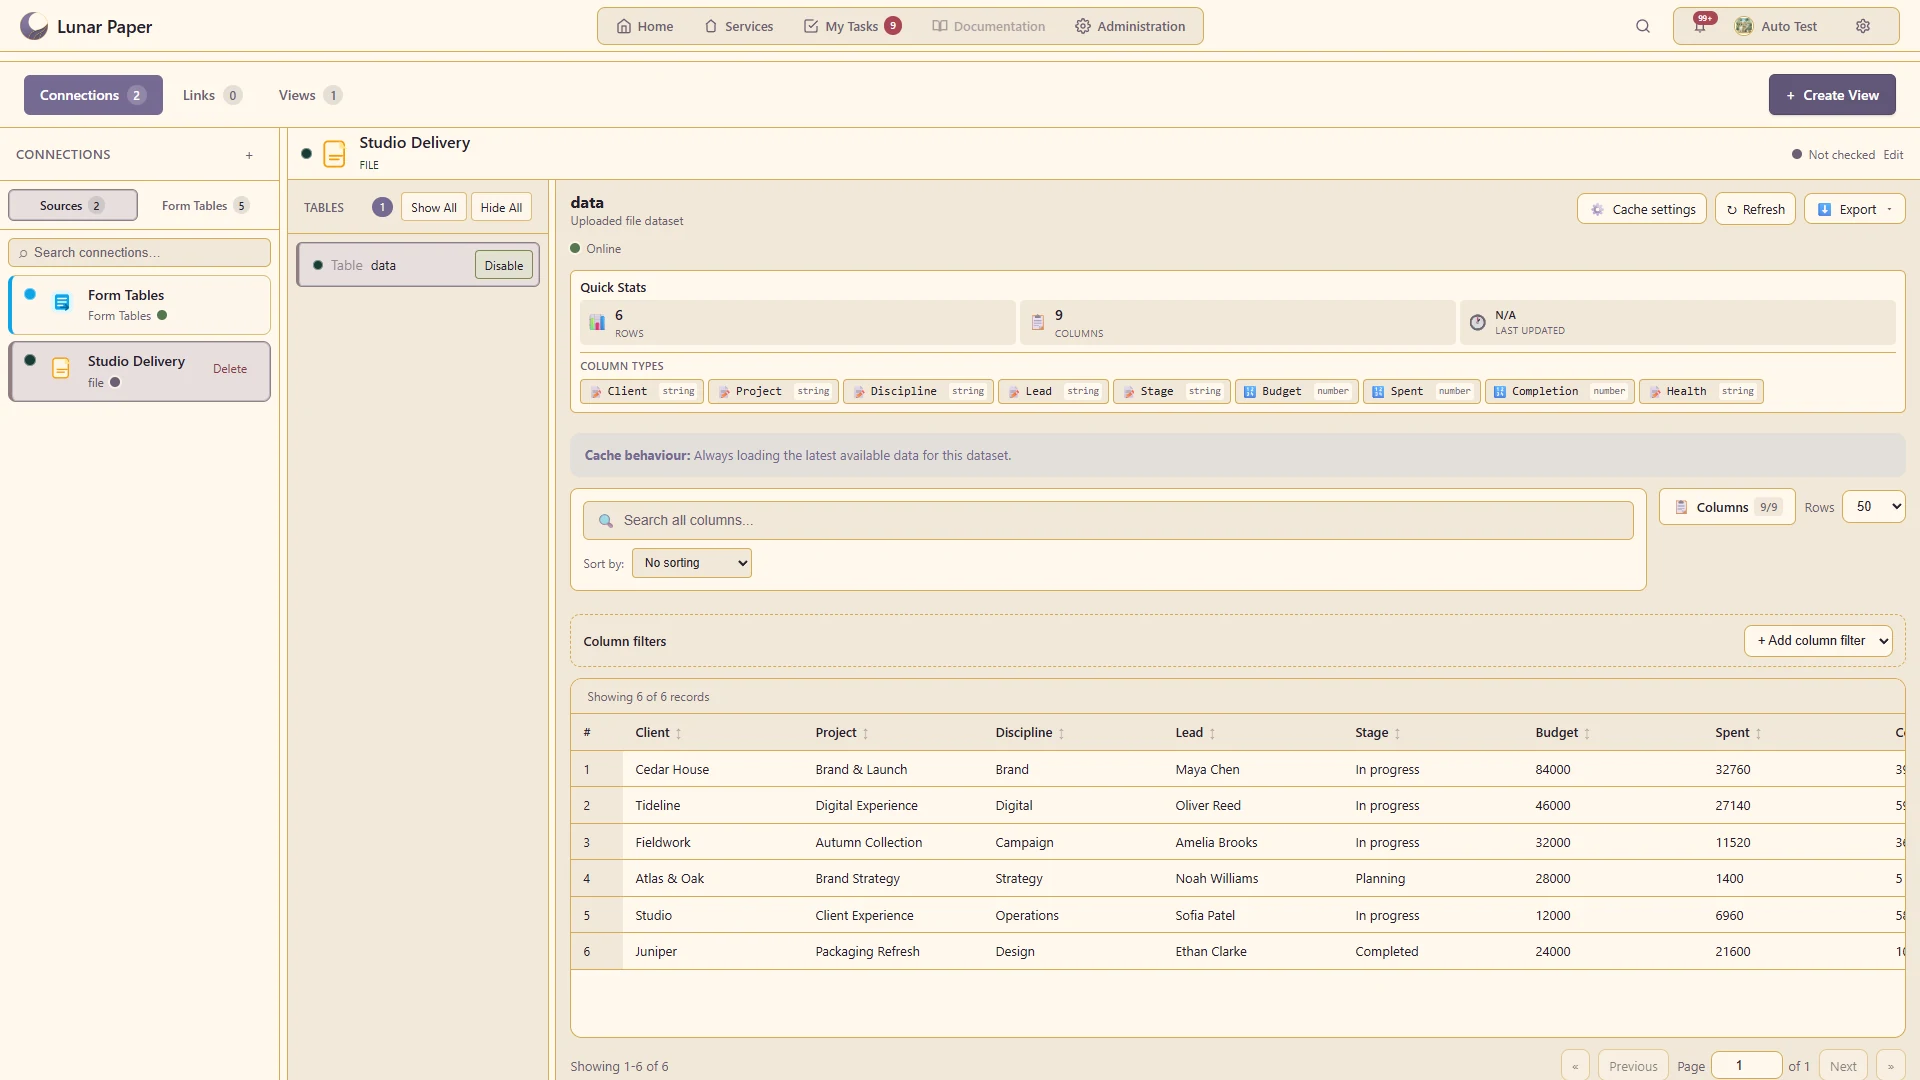
Bring supported tabular files into the same browsing and query experience.

The uploaded studio delivery file becomes a browsable dataset with six engagements, named leads, budgets and delivery progress.
A closer look · 07

Form response data

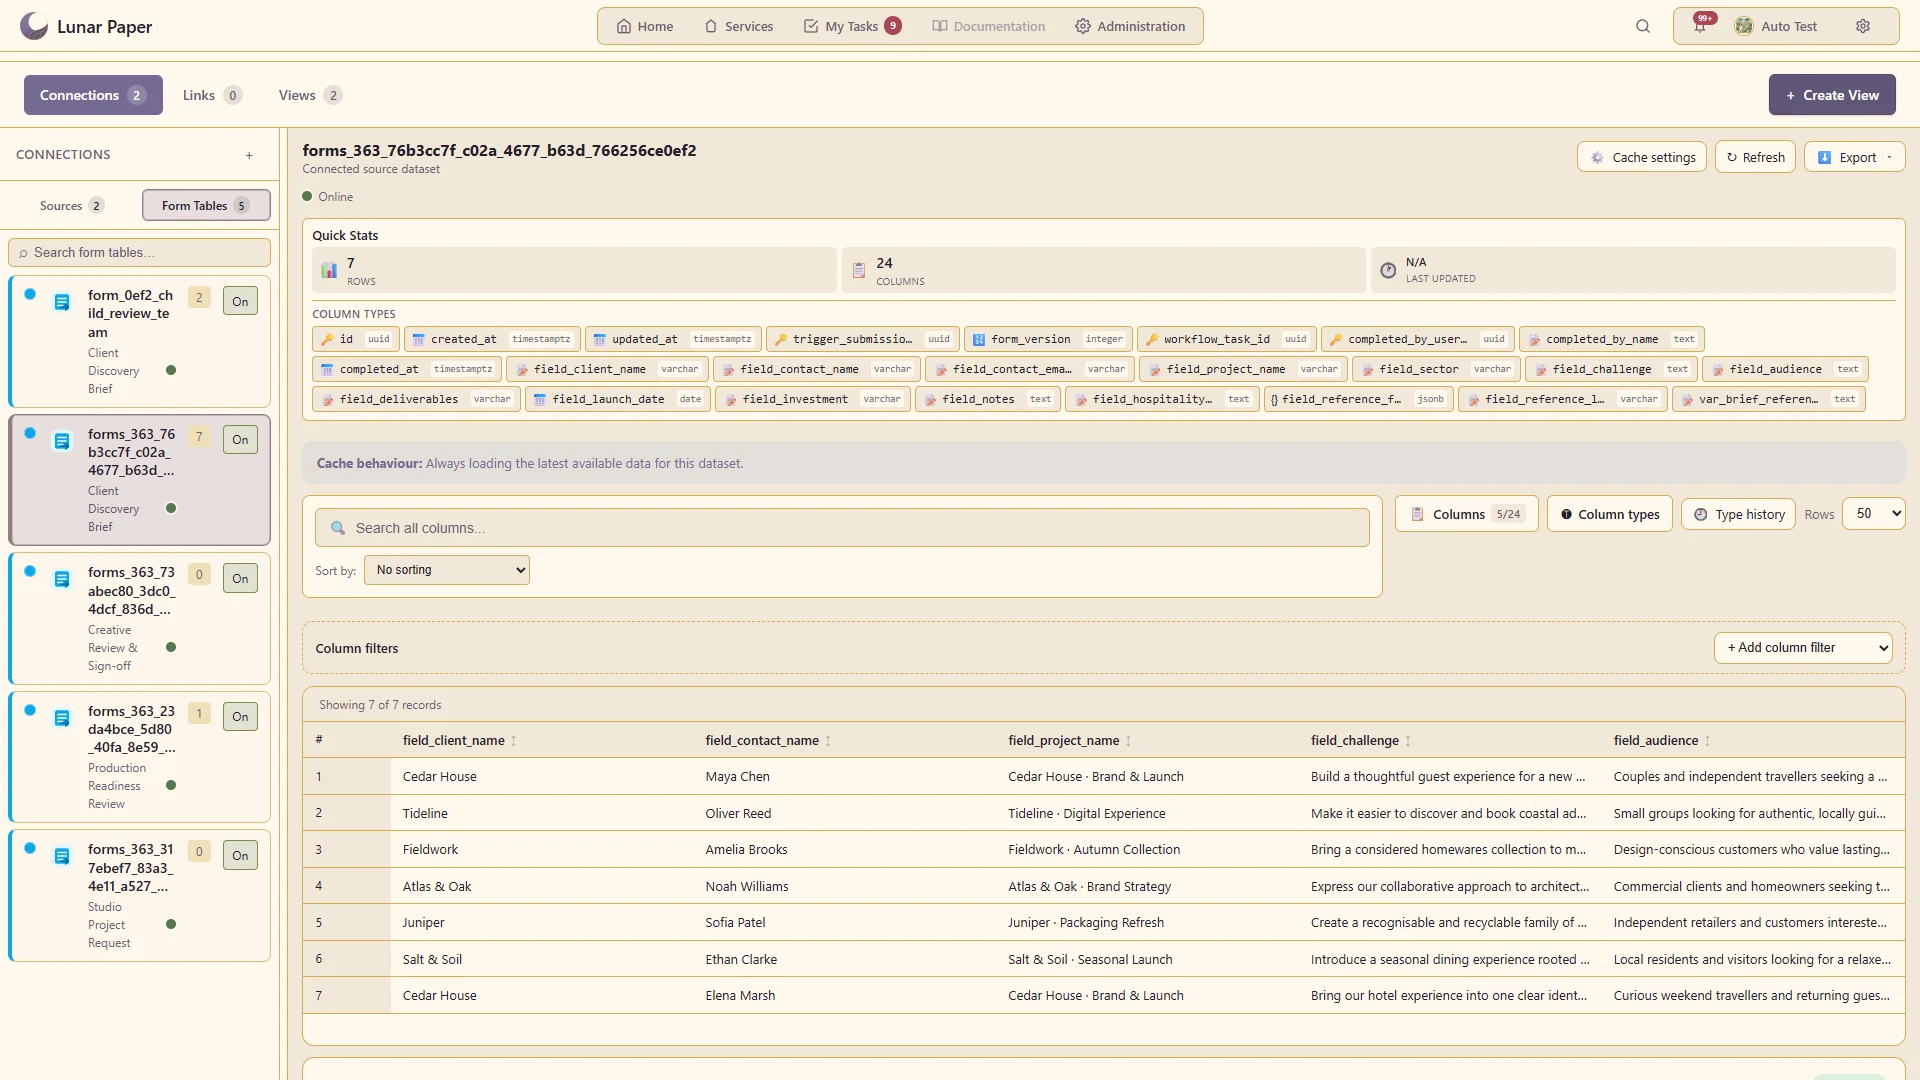
Use submitted form records as a source for reporting and automation.

Browse the submitted client briefs as reporting data, including the business challenge and intended audience.
A closer look · 08

Table and schema browsing

Inspect available tables, columns and their types before building a view.

Inspect the delivery dataset’s columns and sample records before choosing the fields for a reusable view.
A closer look · 09

Live data preview

Inspect real rows and confirm the chosen source contains the required information.

Inspect the seven submitted briefs with client contacts, sector, launch dates and investment ranges.
A closer look · 10

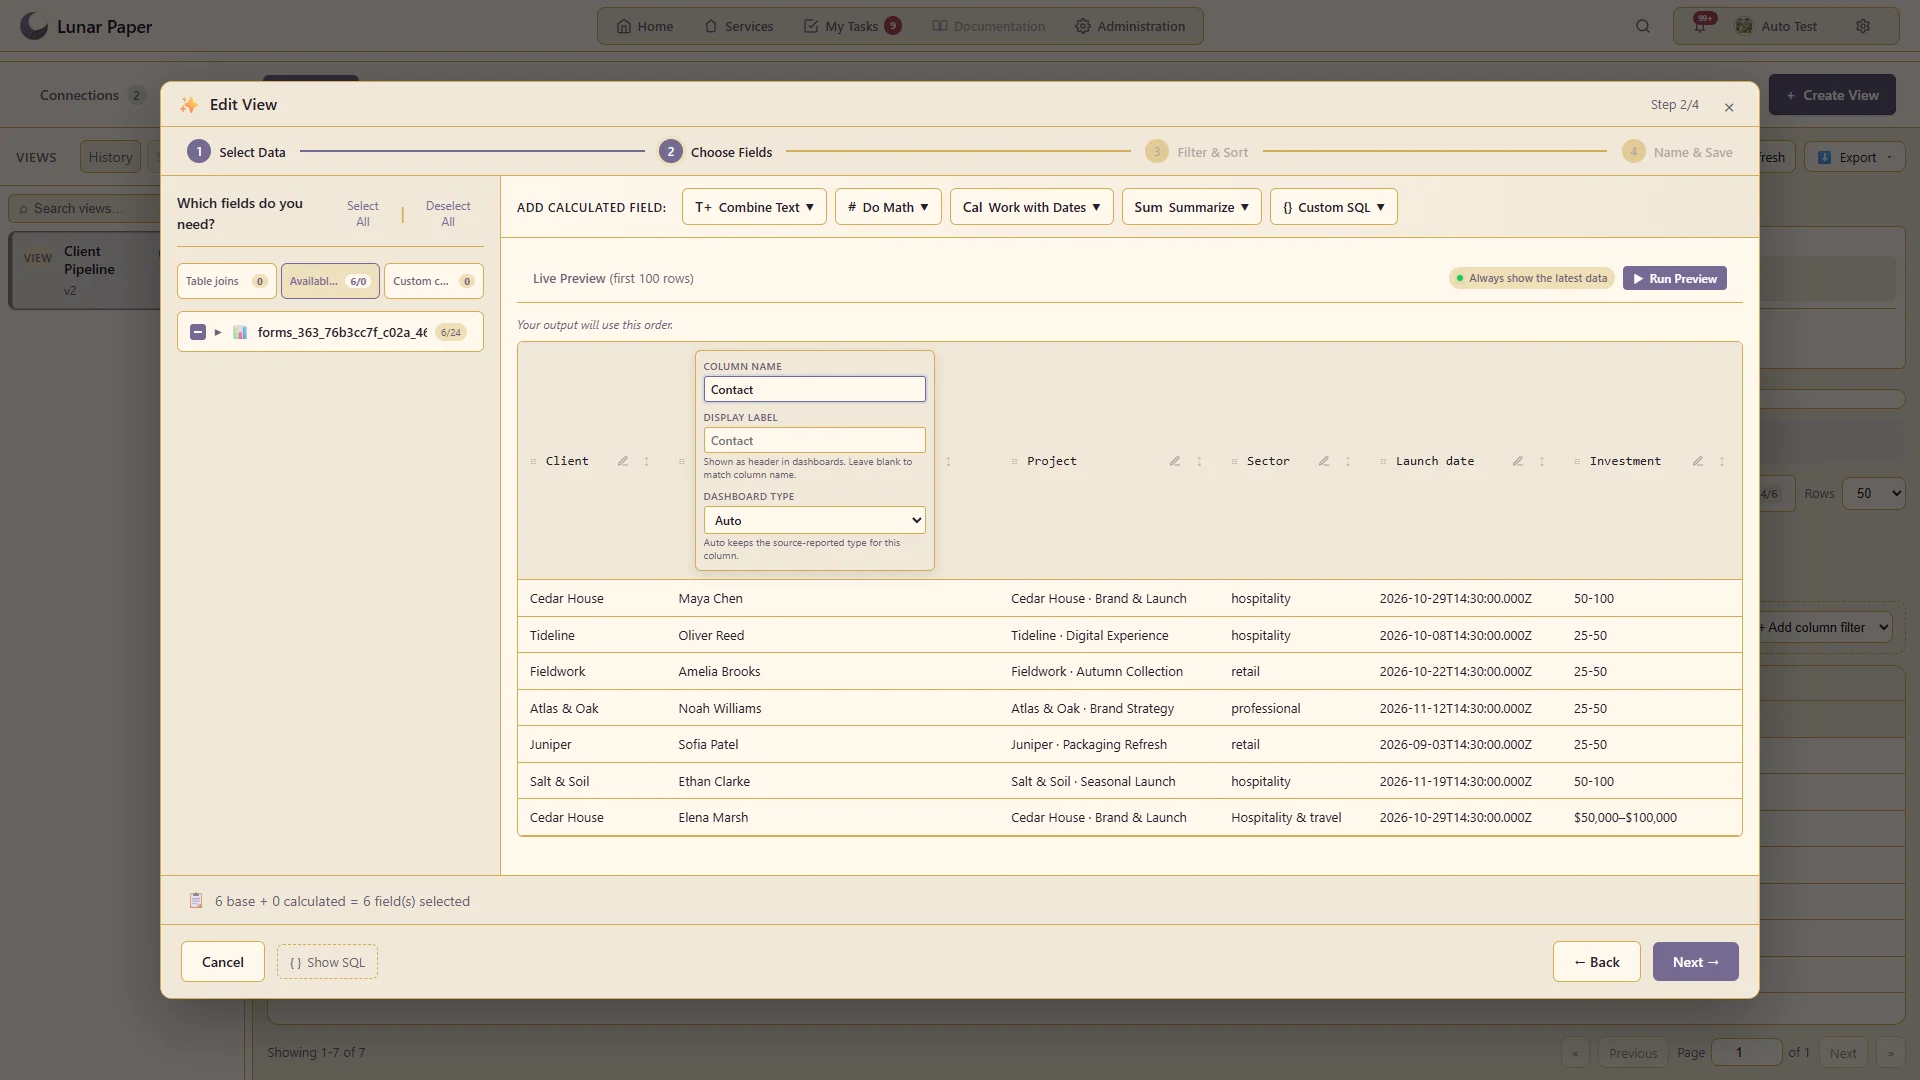
Field selection and naming

Present meaningful business columns instead of exposing every raw field.

Keep source fields intact while assigning clear output names and display labels for report readers.
A closer look · 11

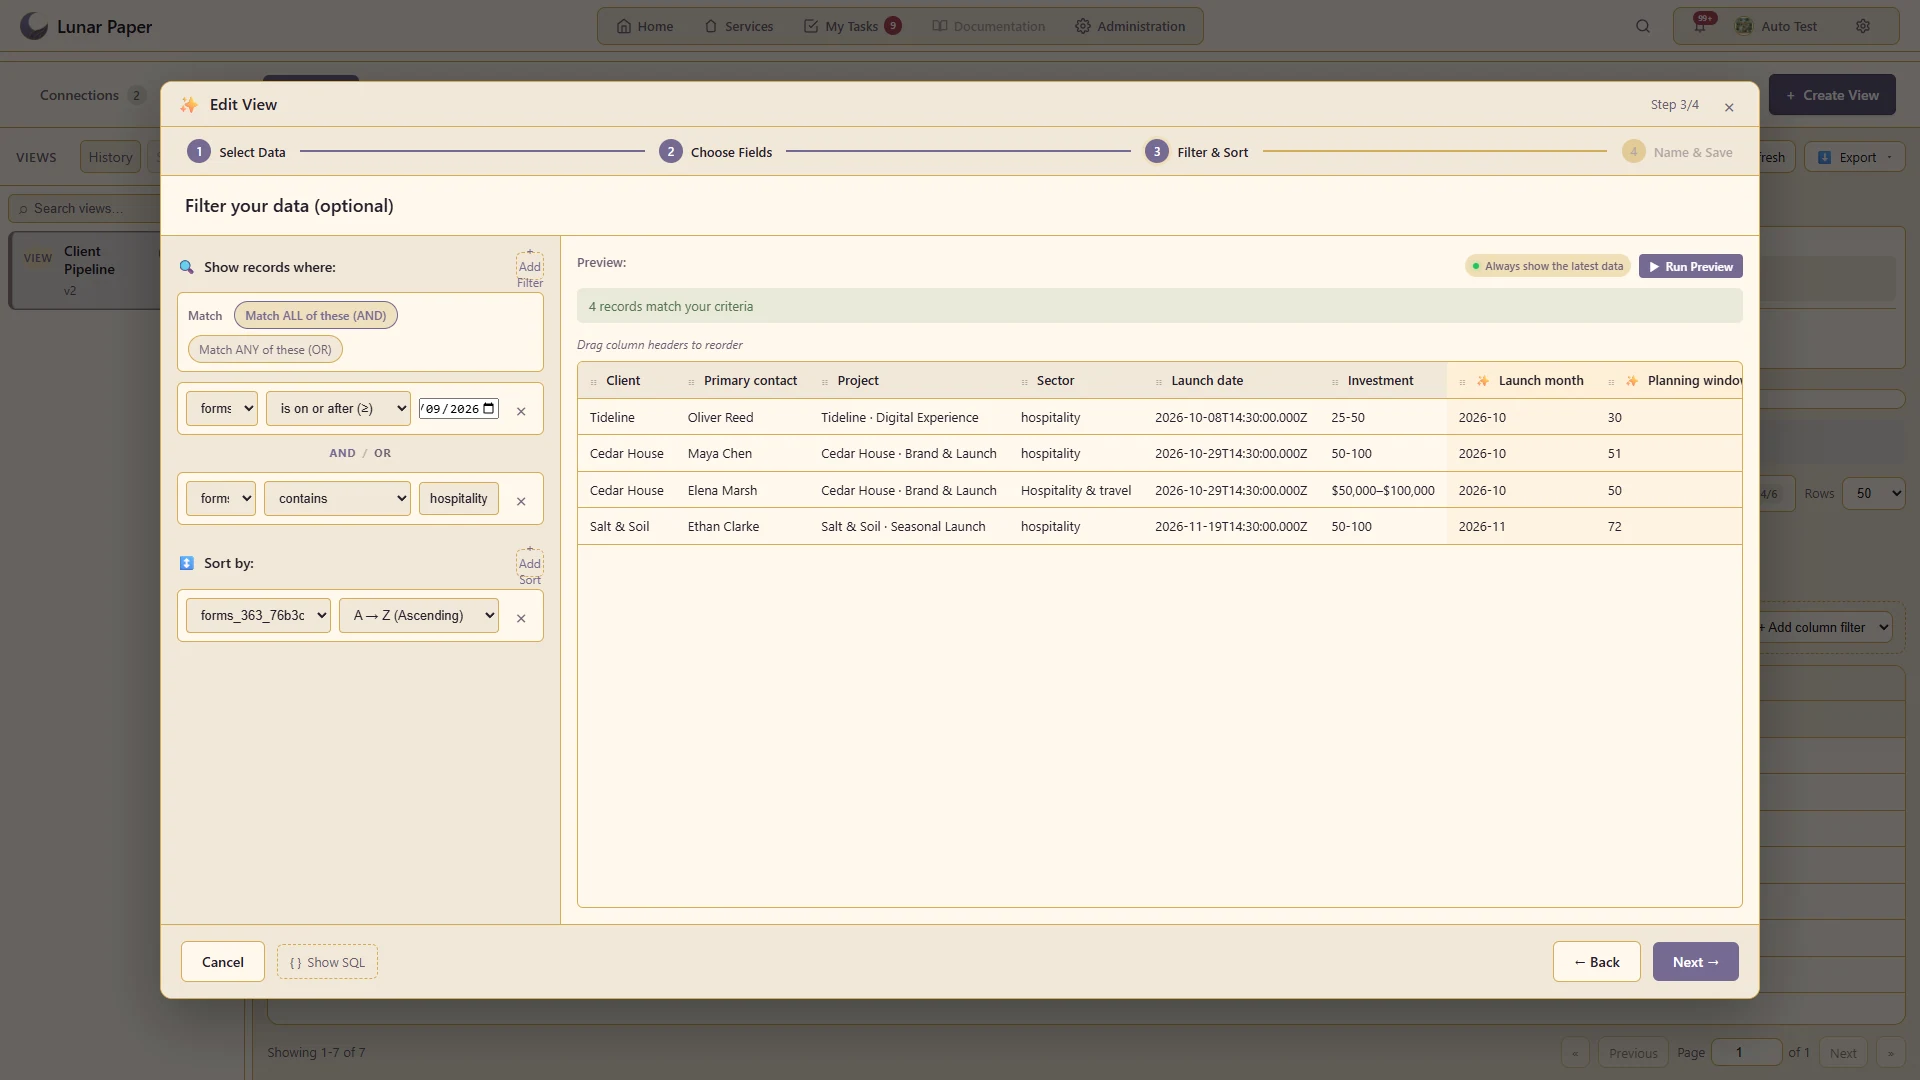
Filter groups

Define the criteria that make a saved view useful to a particular business question.

Combine a future launch date with a hospitality-sector filter, leaving four relevant briefs in chronological order.
A closer look · 12

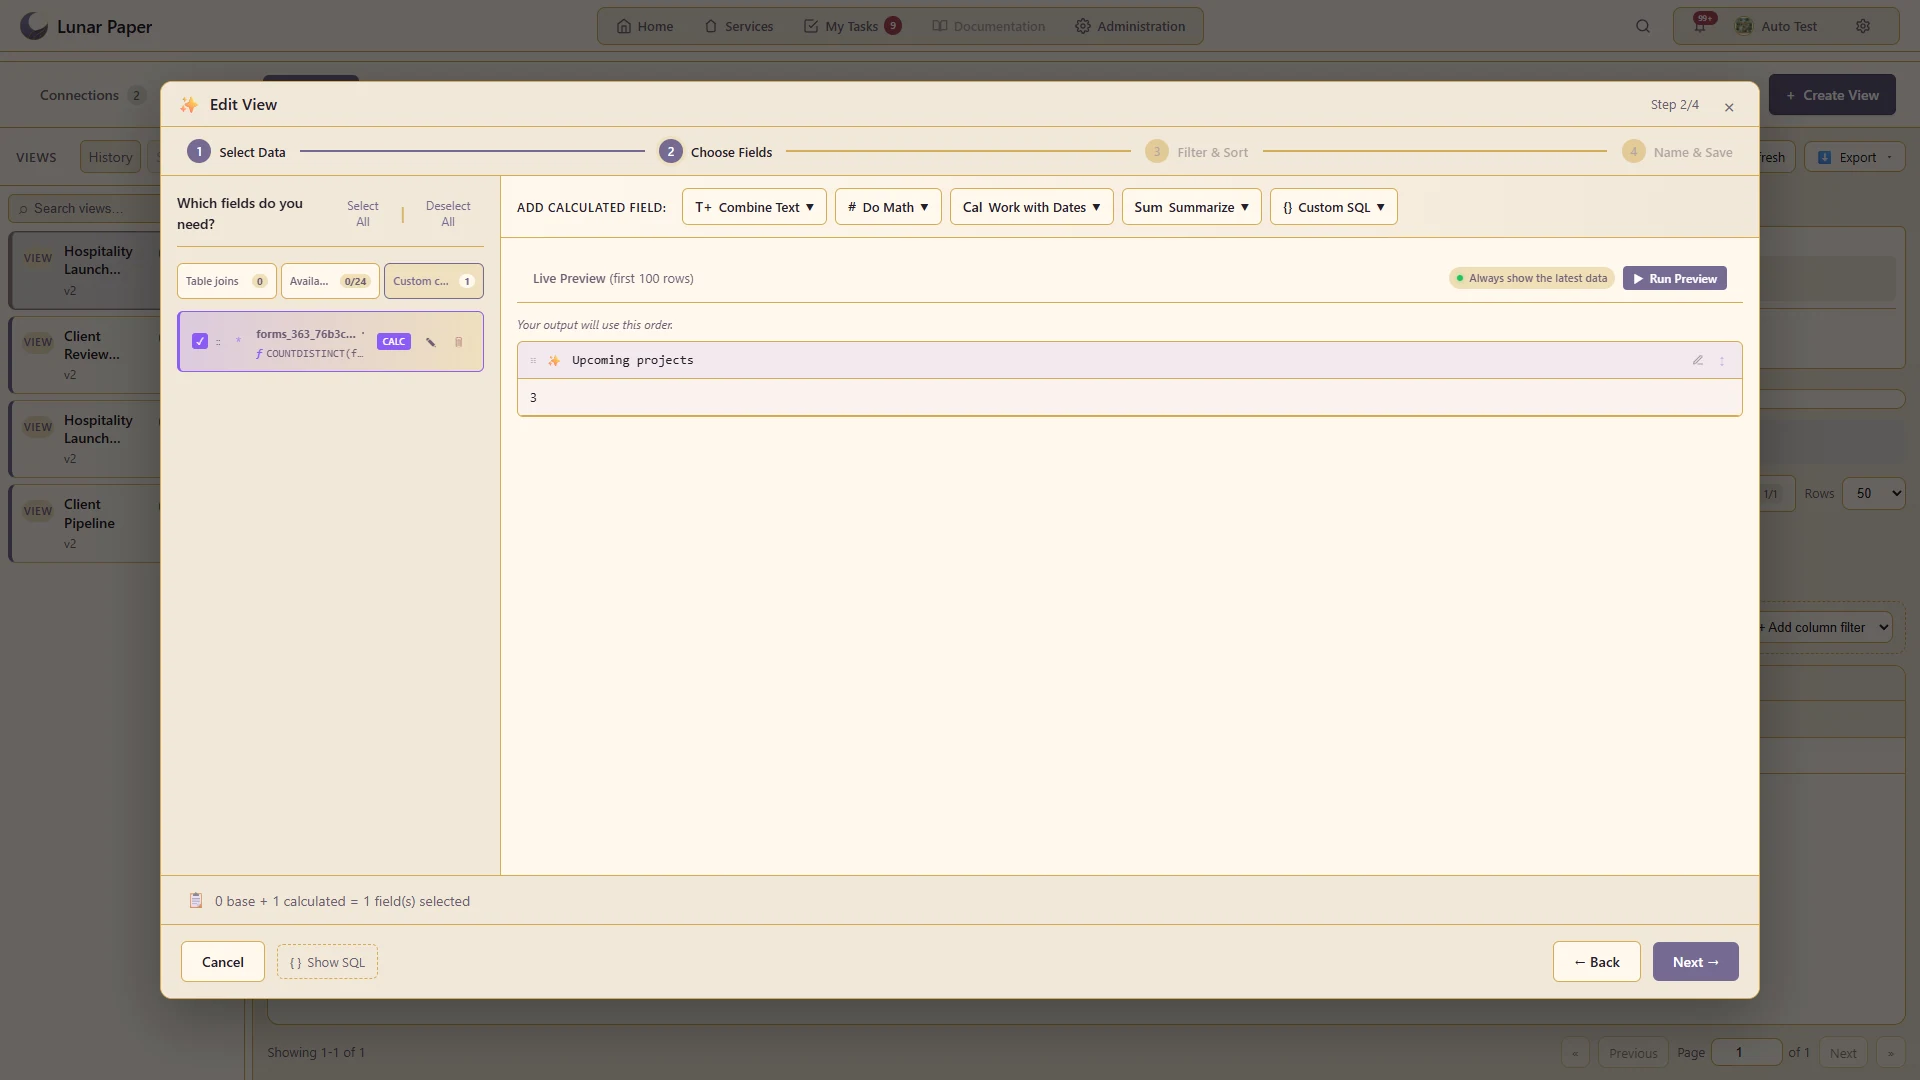
Sorting and aggregation

Order results and summarise records for downstream consumers.

Summarise four upcoming hospitality briefs into three distinct client projects, with the calculated result visible in the preview.
A closer look · 13

Date calculations

Work with dates through the formula tools rather than manually maintaining derived columns.

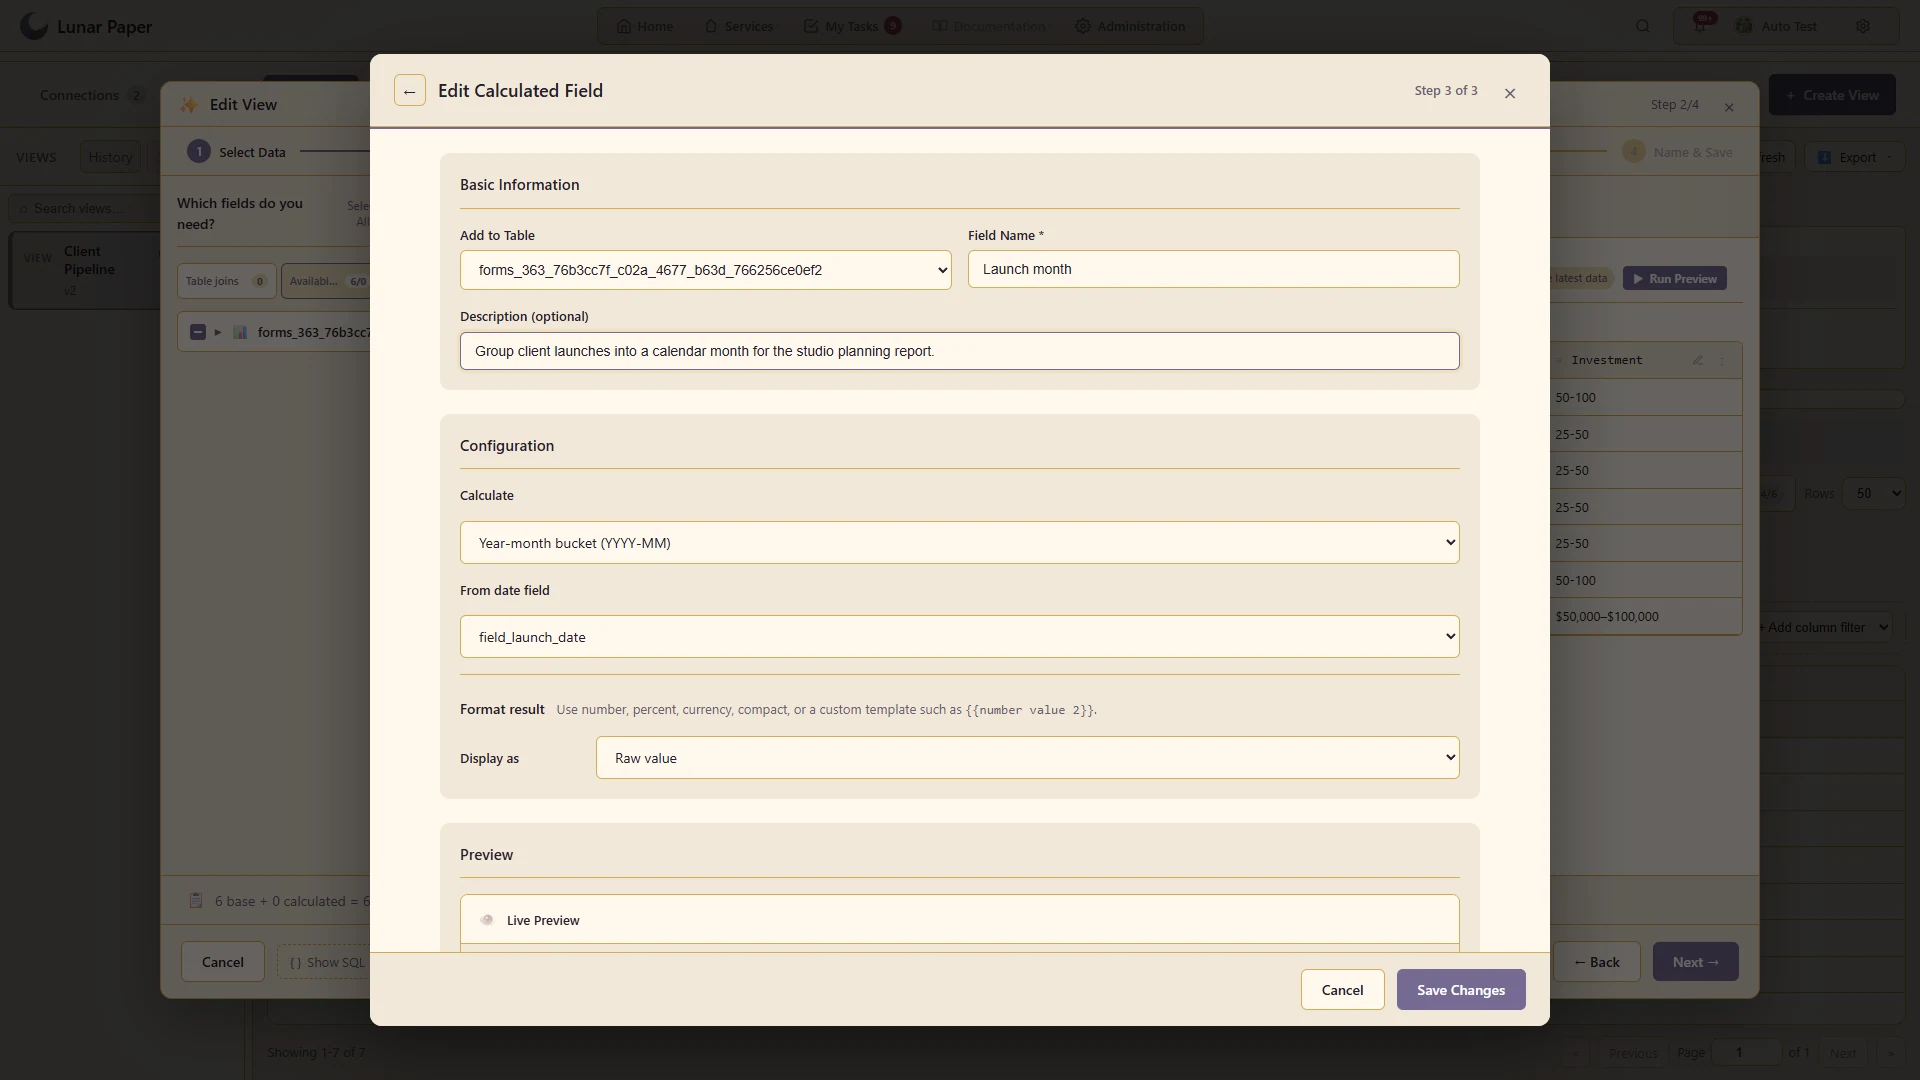
Derive a launch-month reporting bucket directly from each brief’s launch date.
A closer look · 14

Text and category formulas

Combine labels or classify records into useful reporting groups.

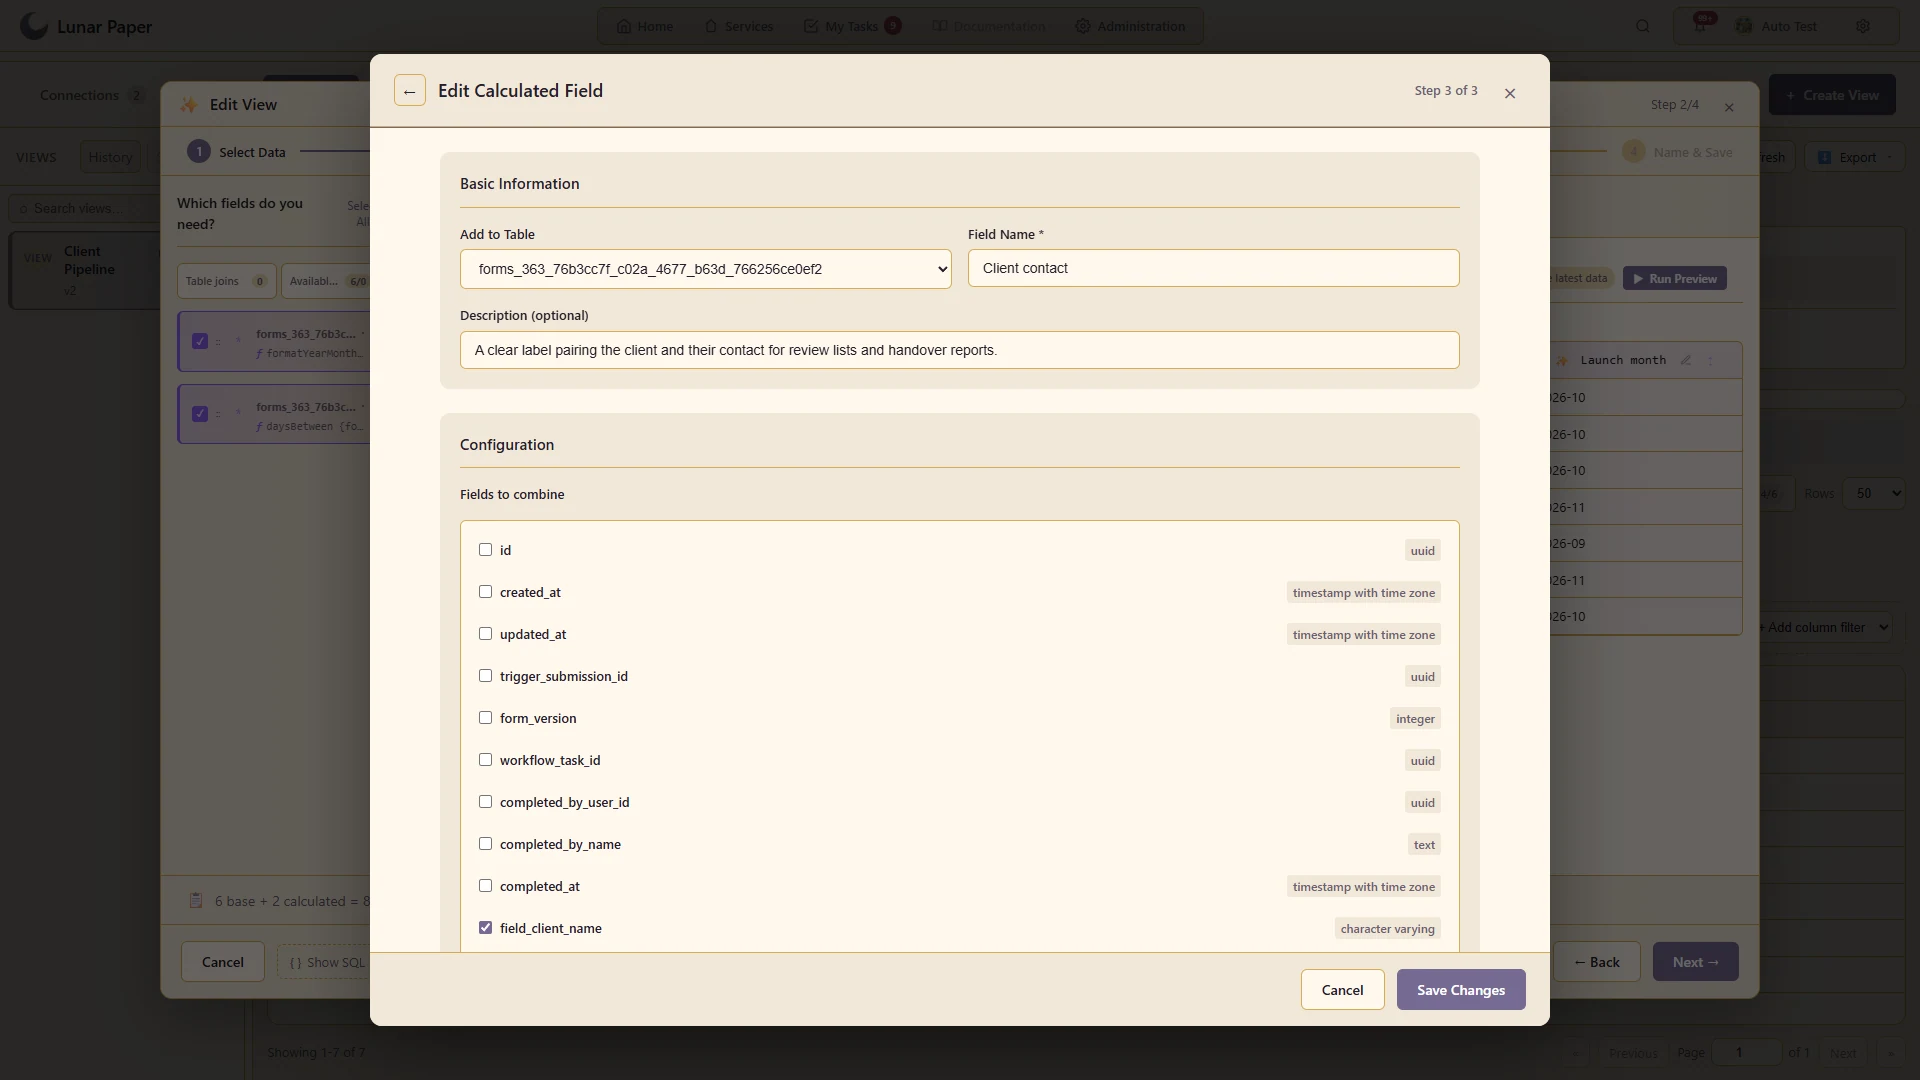
Combine the client and primary contact into a consistent label for review lists and handover reports.
A closer look · 15

SQL inspection and authoring

Inspect or edit the supported SQL representation in the saved-view workflow.

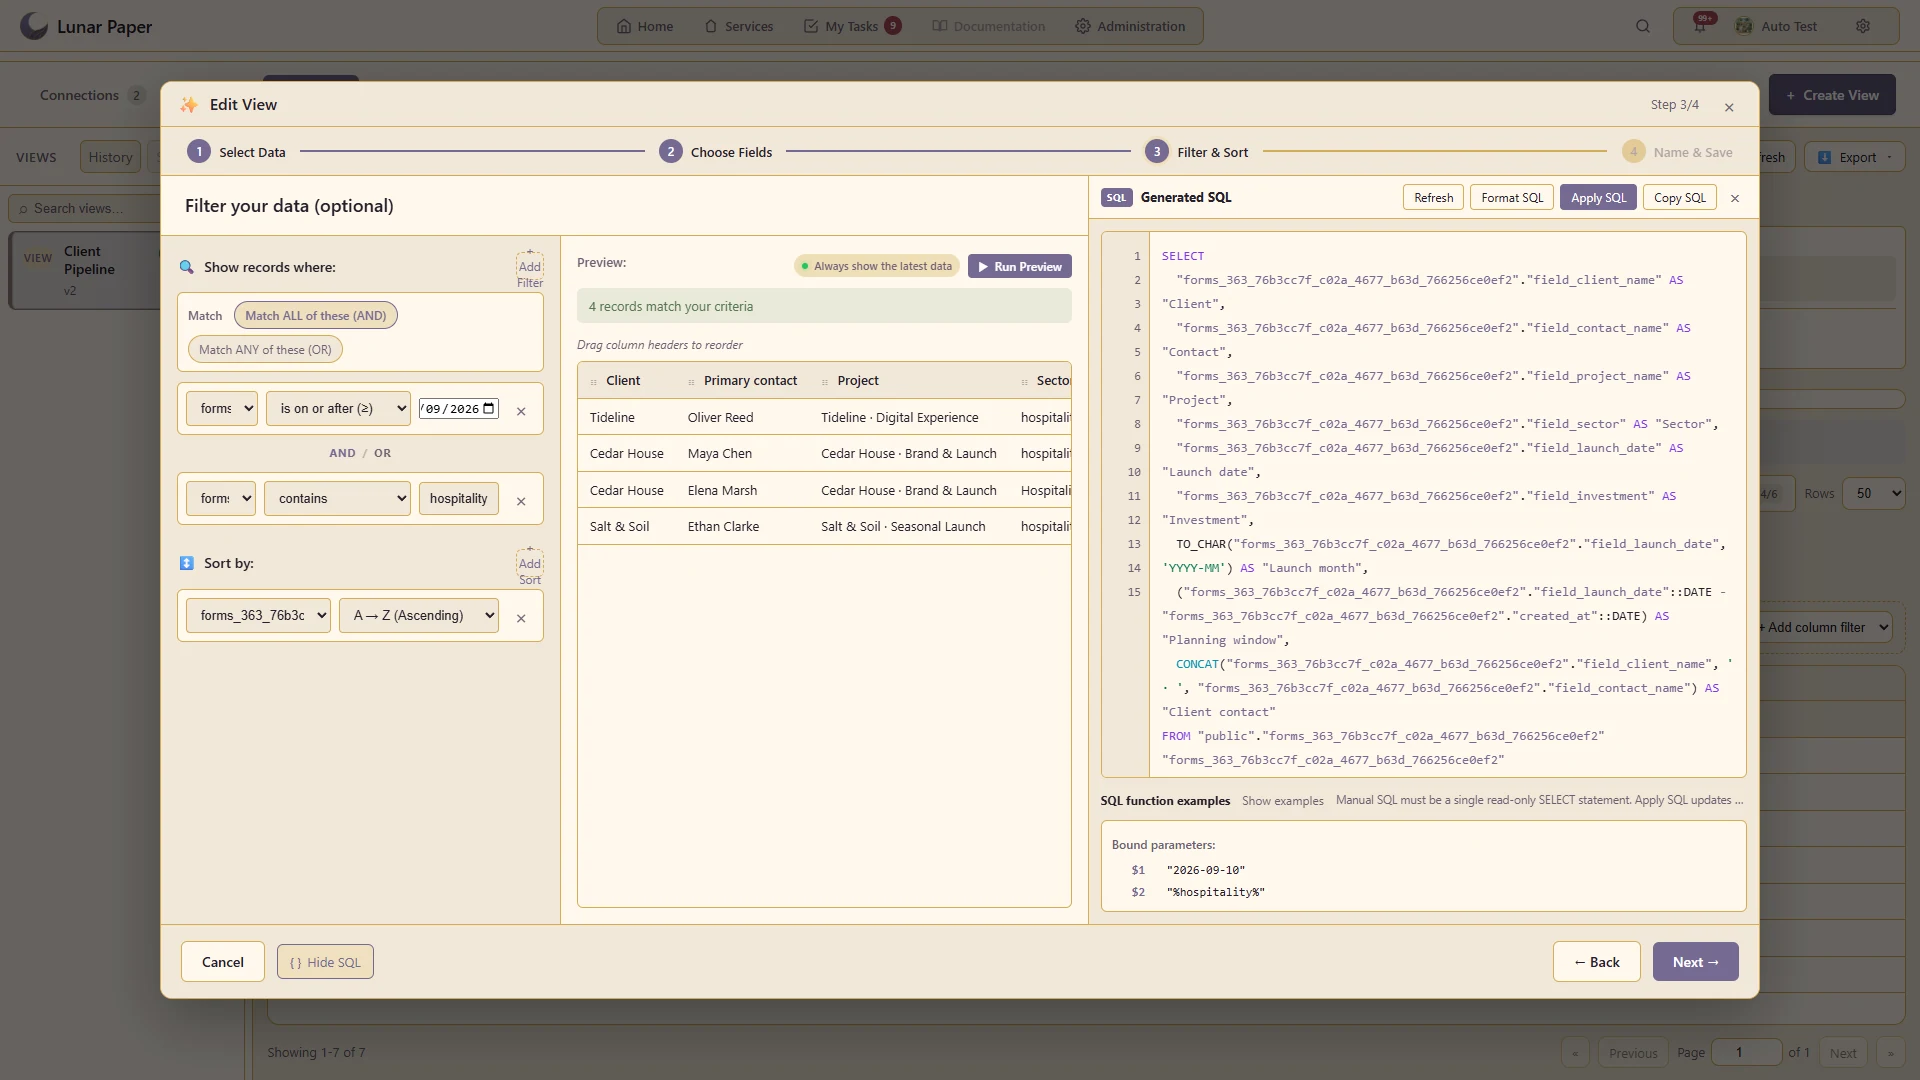
Inspect the generated SQL for selected columns, calculated fields, filters and launch-date ordering.
A closer look · 16

Cache policy

Choose how freshness and cached results should be handled for a dataset or view.

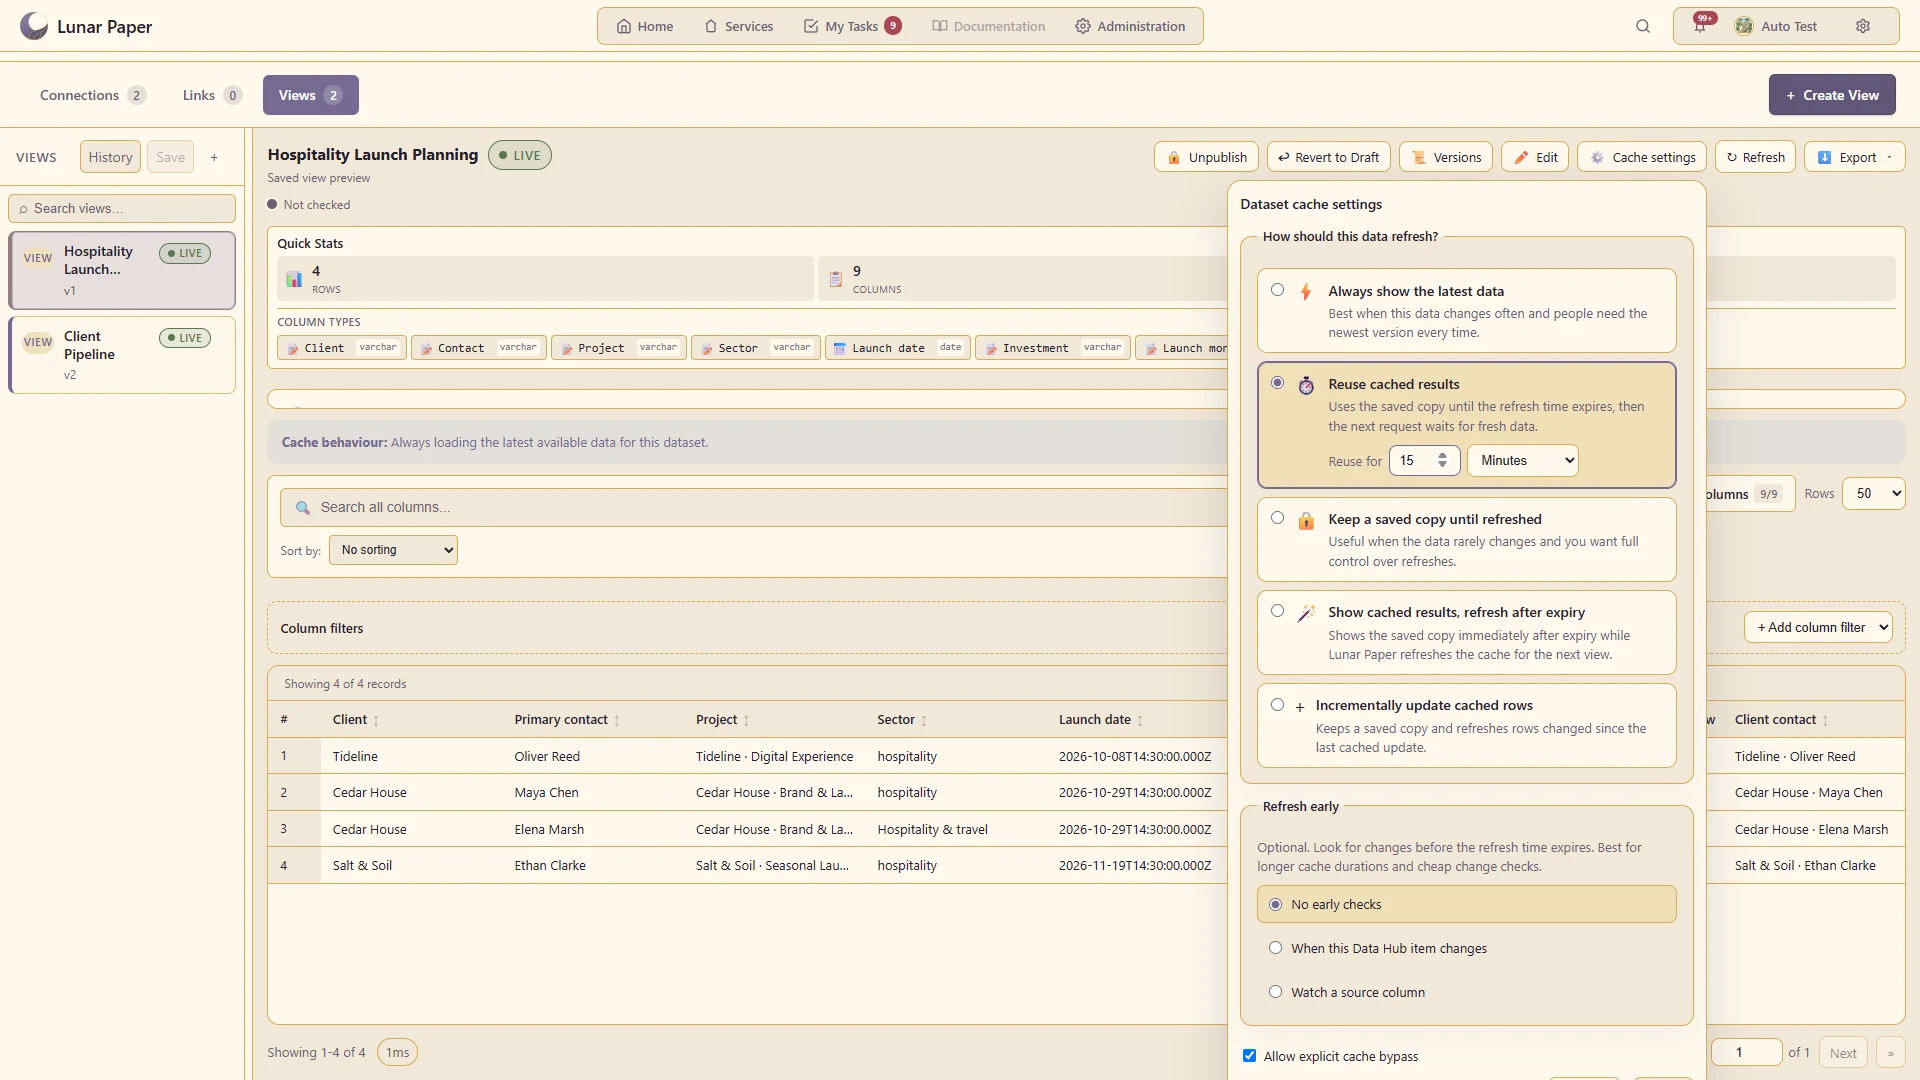
Reuse the launch-planning results for fifteen minutes while allowing an explicit refresh when the team needs current data.
A closer look · 17

Runtime filters and selections

Let consuming applications ask for a relevant subset of the same underlying data.

Select Cedar House in the consuming dashboard to focus the shared view on its two stakeholder briefs.
A closer look · 18

View versions

Inspect earlier definitions and maintain a history of changes to a shared view.

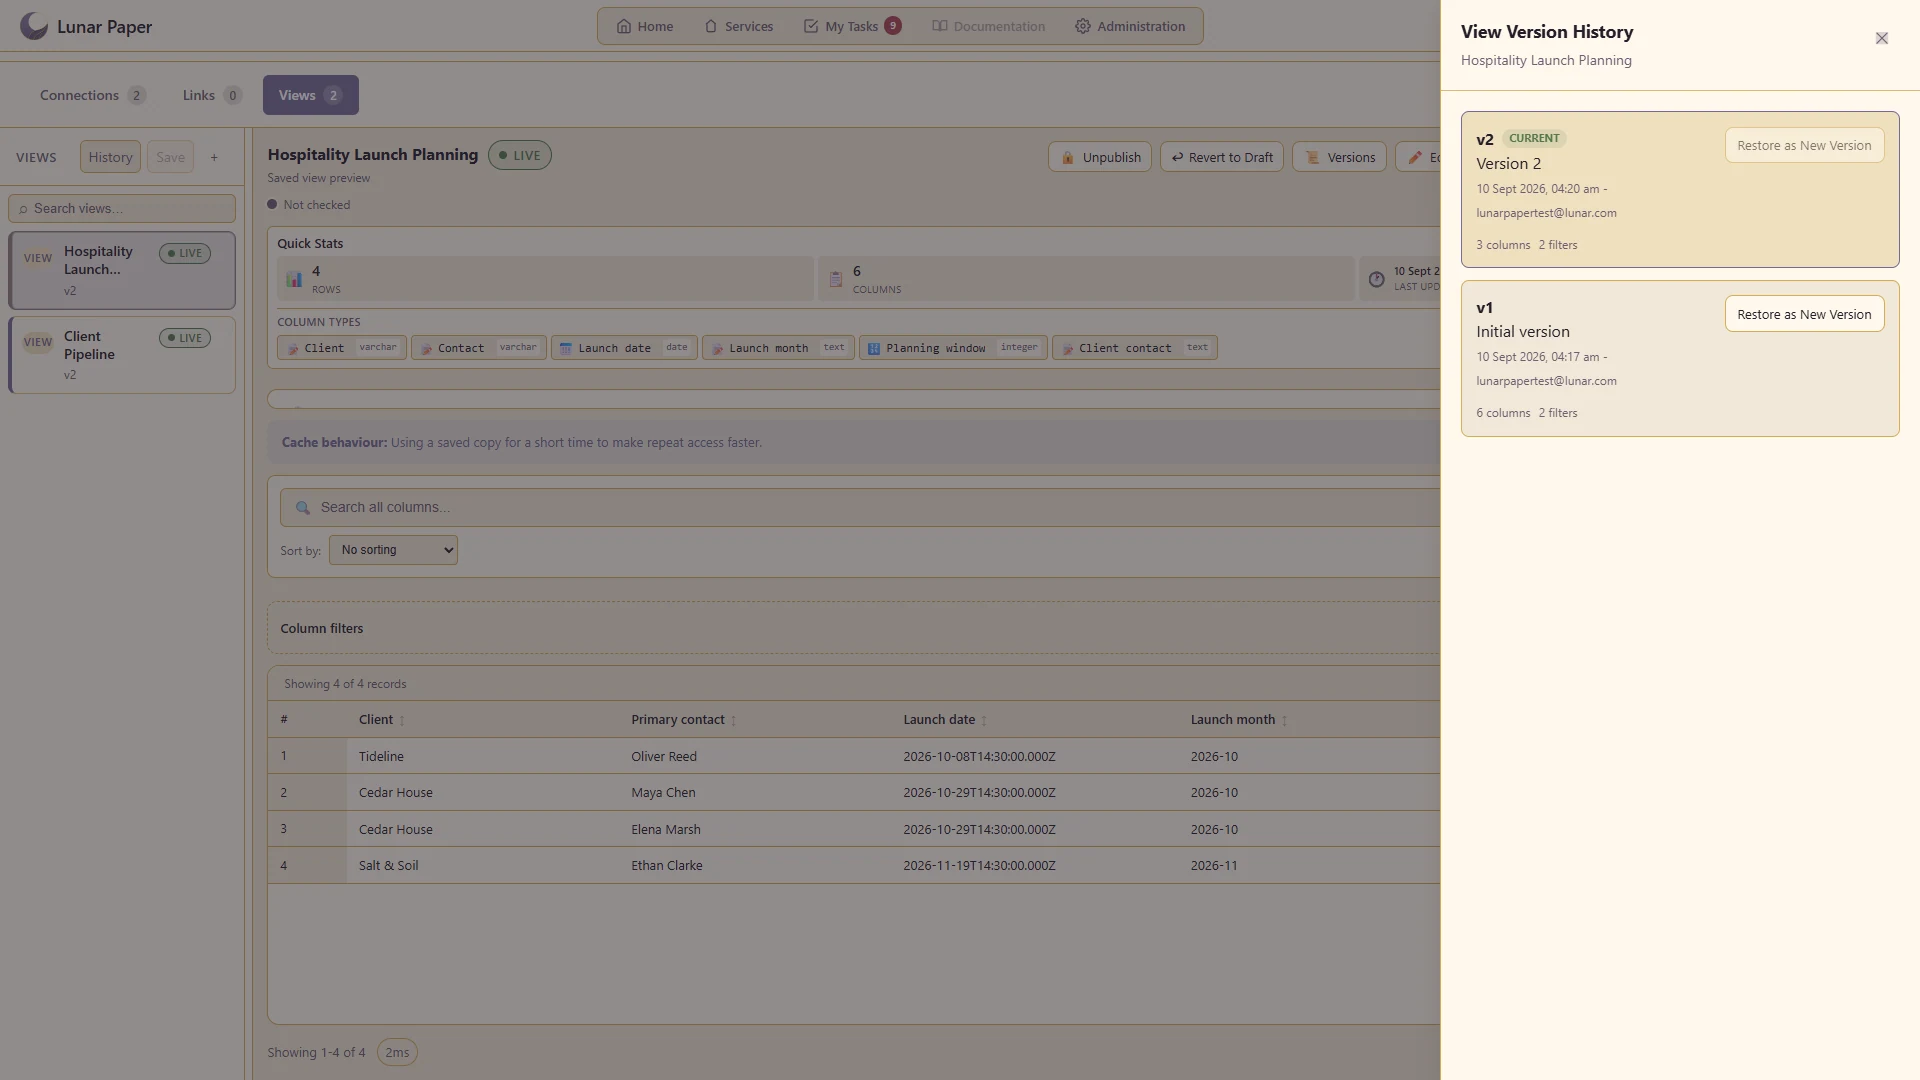
Retain the original planning definition alongside a refined version, with an option to restore an earlier version as a new change.
A closer look · 19

Dependency and consumer information

See where a view is used before changing a shared data definition.

Inspect the forms, workflows and reporting consumers of the shared client pipeline before changing its definition.
A closer look · 20

Data export

Export the displayed/query result using the supported formats and options.

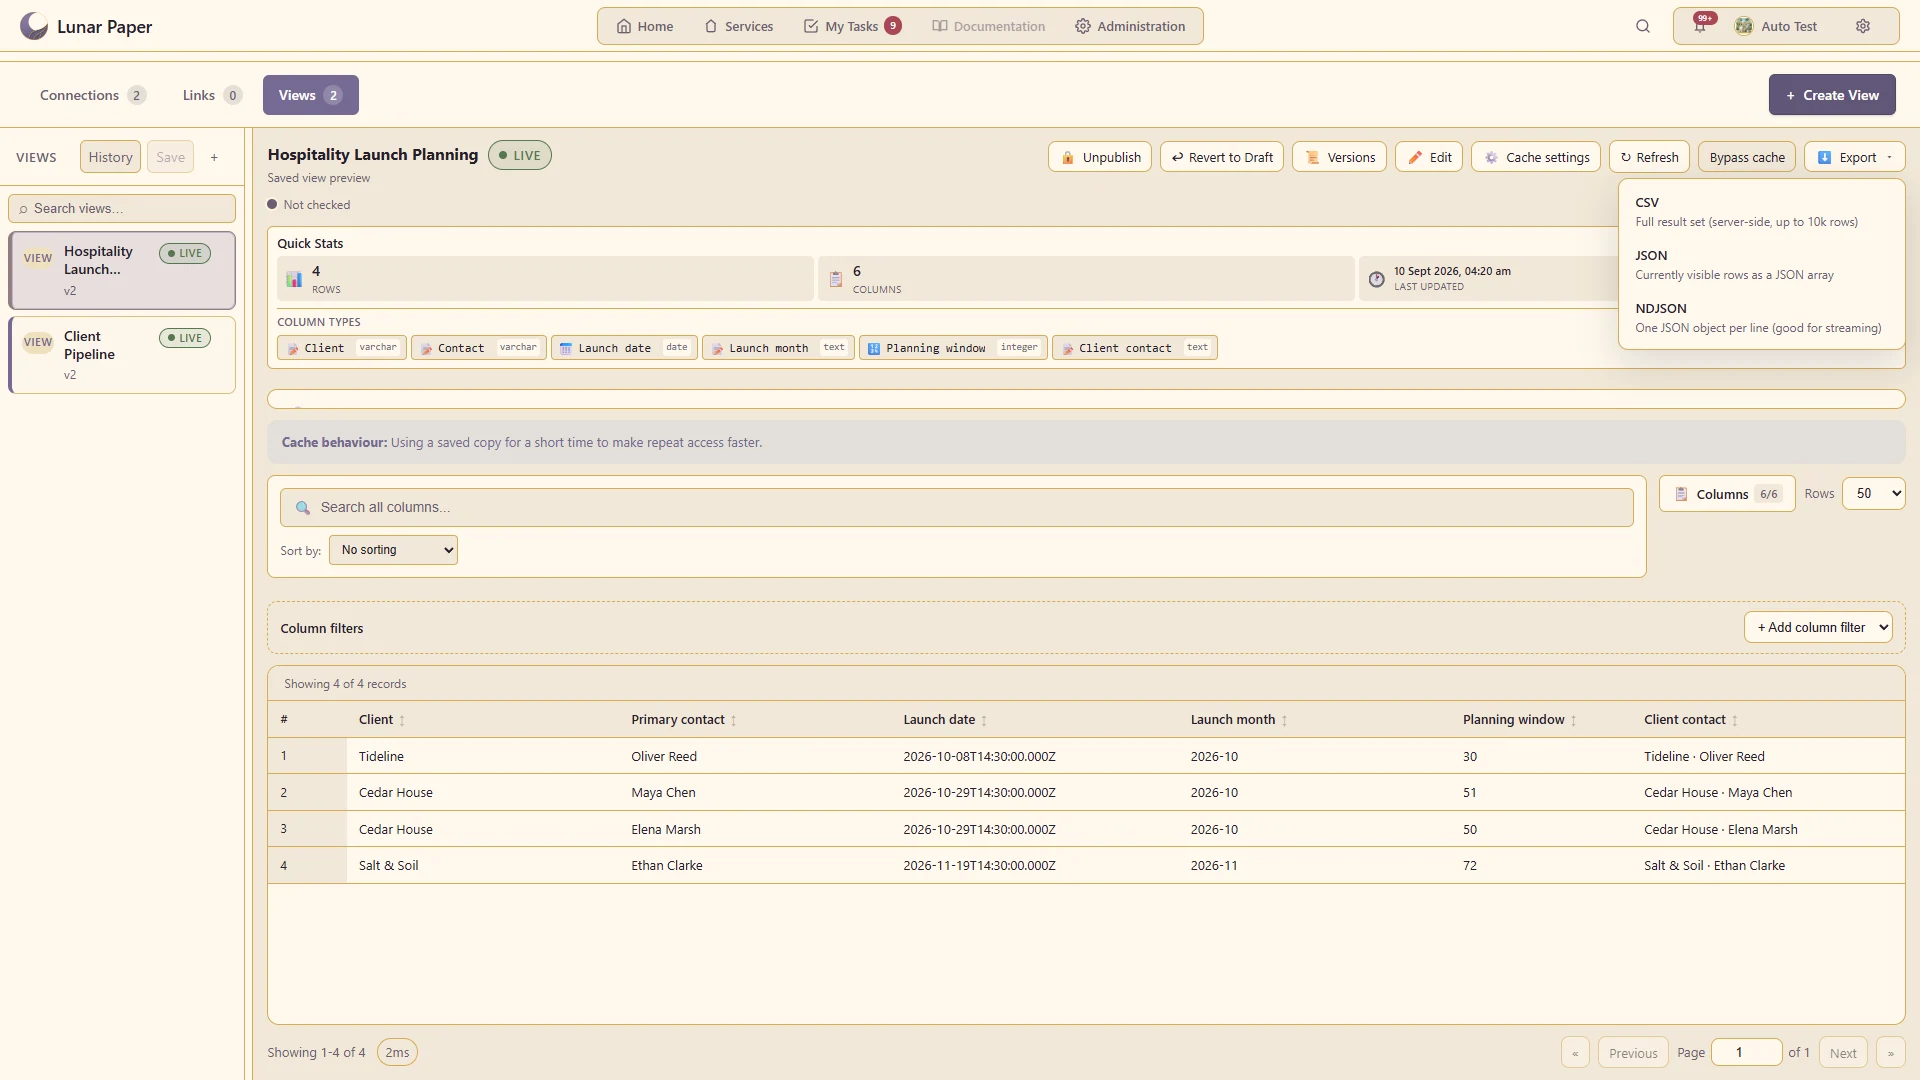
Export the planning result as CSV, JSON or line-delimited JSON, with clear options for the full result or visible rows.

Additional Details

The main areas Data Hub brings together.

Connected sources

Bring databases, cloud warehouses, files, web APIs and internal records into a governed source catalogue.

Dataset exploration

Browse schemas, preview records and understand fields before a source is reused elsewhere.

Relationships and semantics

Define how data connects and add the meaning teams need to use it consistently.

Reusable views

Build filtered, sorted and calculated views that applications can reuse without rebuilding the same logic.

Freshness and lineage

Control caching and availability while retaining context about where a view came from and where it is used.

Governed exchange

Support controlled export, writeback and automation where operational processes need data to move.

Get started

Try it on your own machine

Run the platform with all features for free for three people.