
Lunar Paper
English
Applications / Data and reporting

Dashboards

Turn connected data into dashboards, long-form reports and repeatable publications. Dashboards combines a flexible widget canvas, live Data Hub sources, interactive filtering, collaboration, versioned publishing, exports and scheduled delivery, so teams can explore performance and share the same trusted picture in the format each audience needs.

Highlights · 01

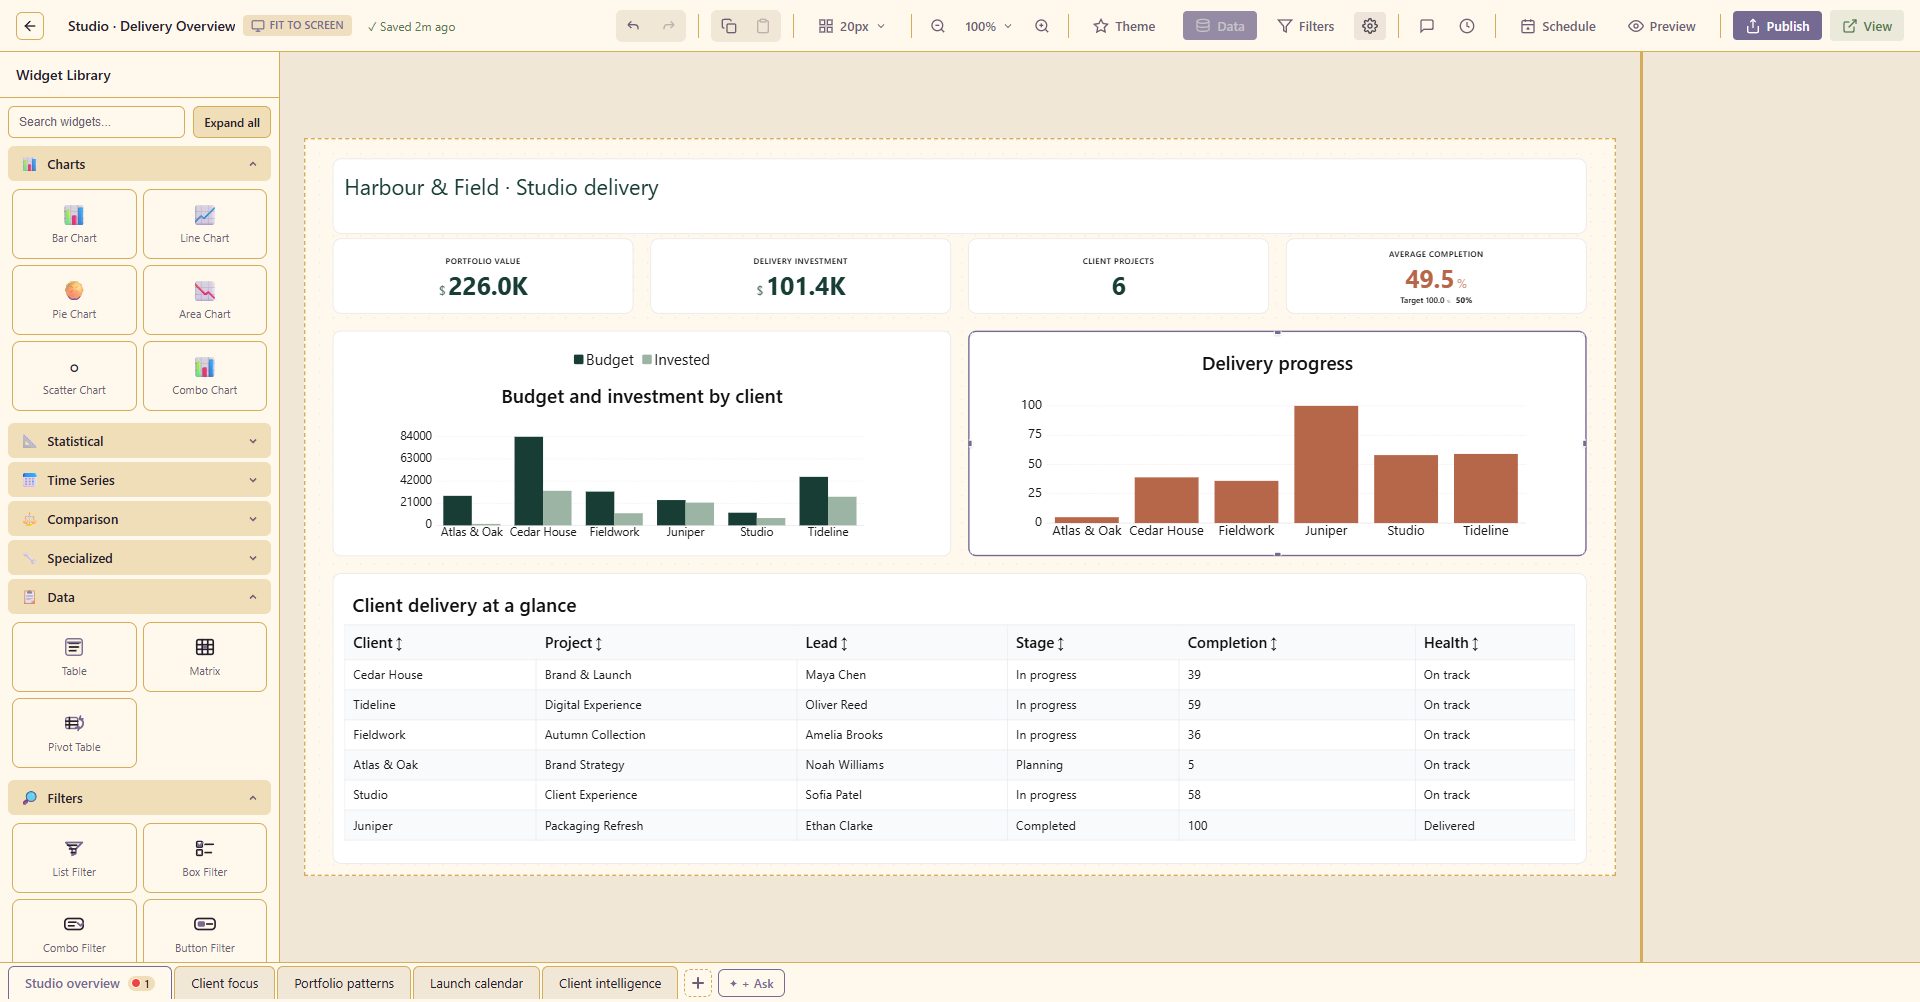
Interactive dashboard canvas

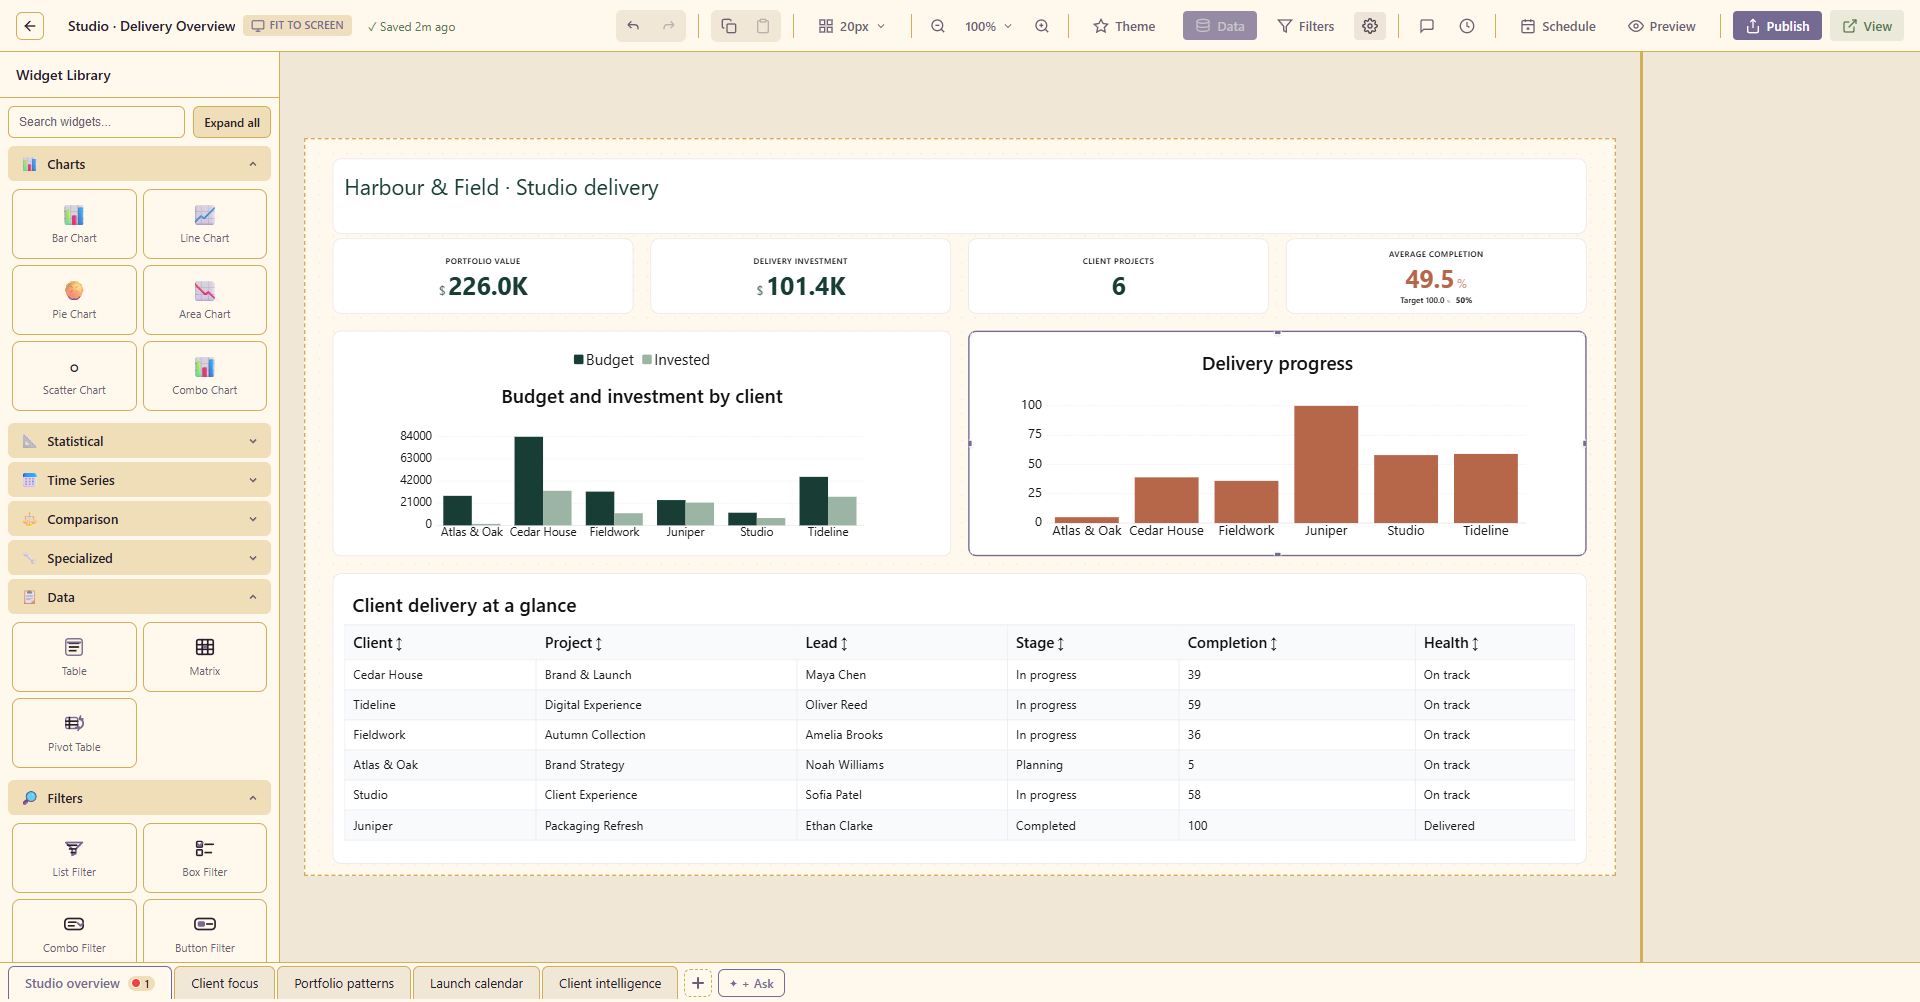
Arrange charts, tables and measures into a coherent view of the business.

A live studio overview brings together project budgets, progress, portfolio charts and delivery records
Highlights · 02

Filter widgets

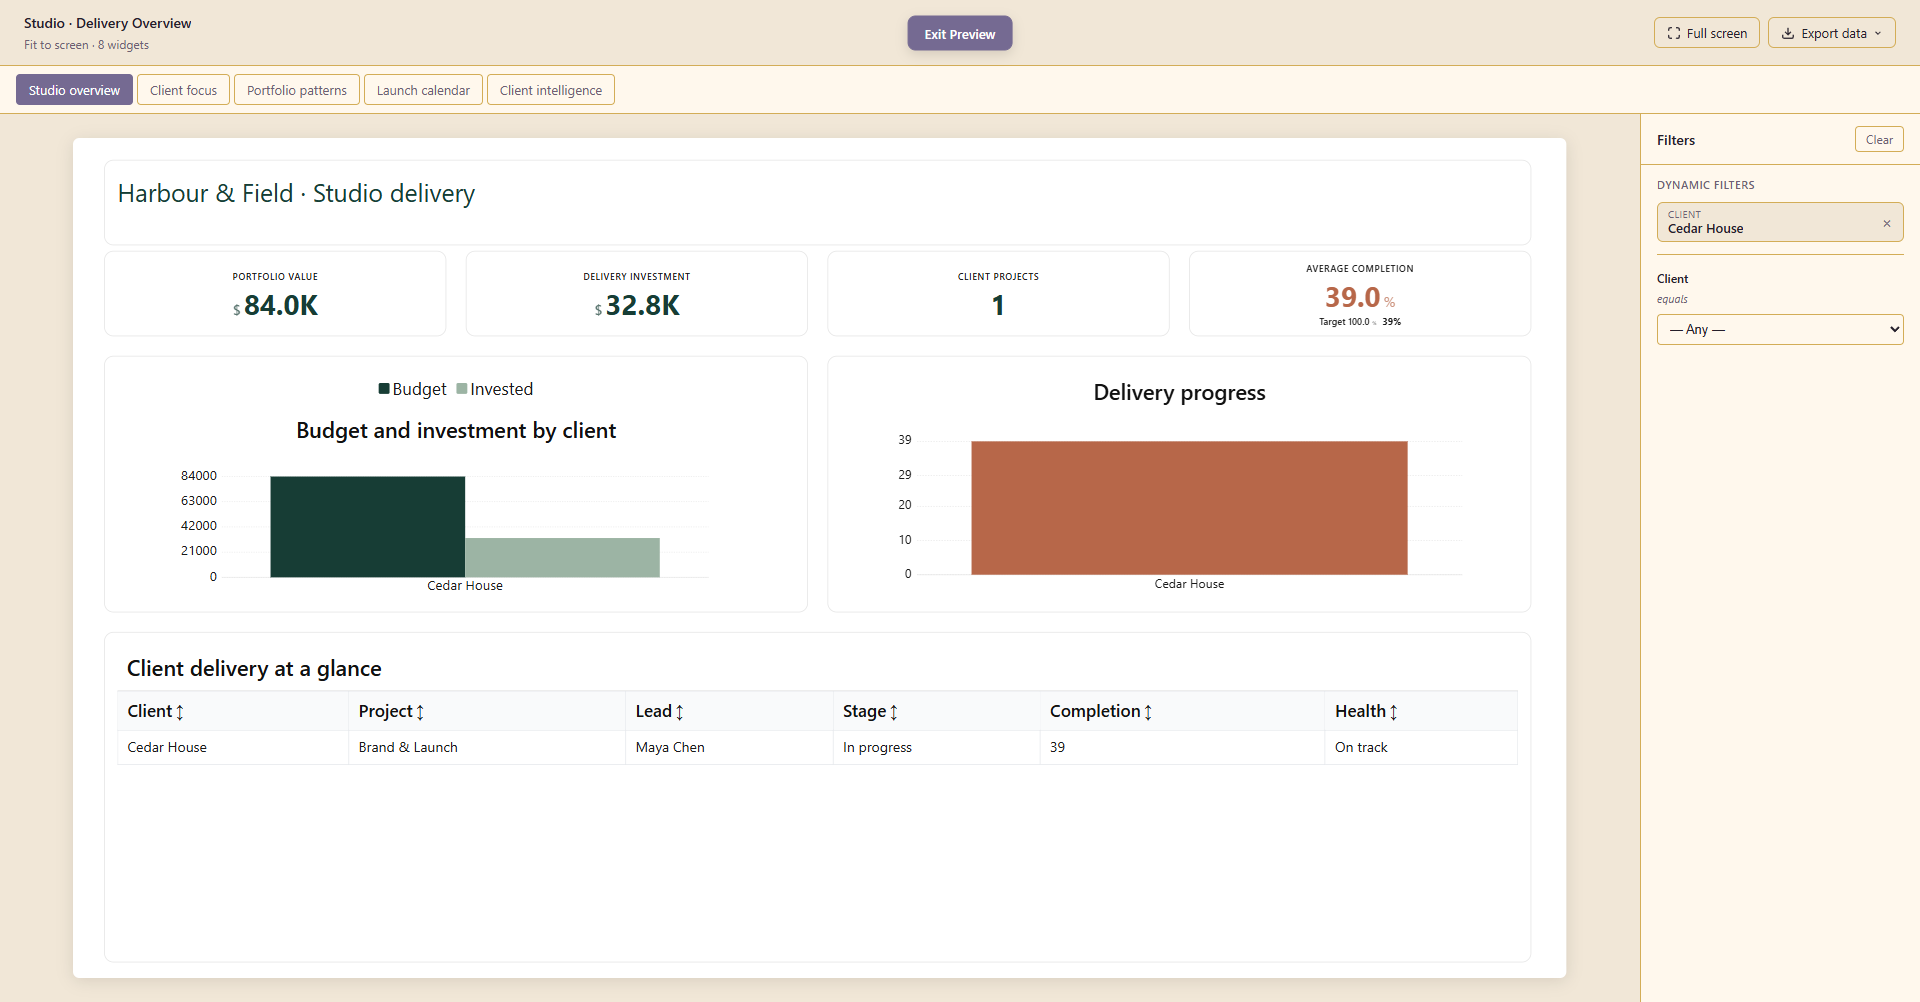
Let readers explore data using lists, boxes, dropdowns or buttons on the dashboard itself.

Select Cedar House to filter the investment measures, chart and delivery detail together
Highlights · 03

Explore from a chart

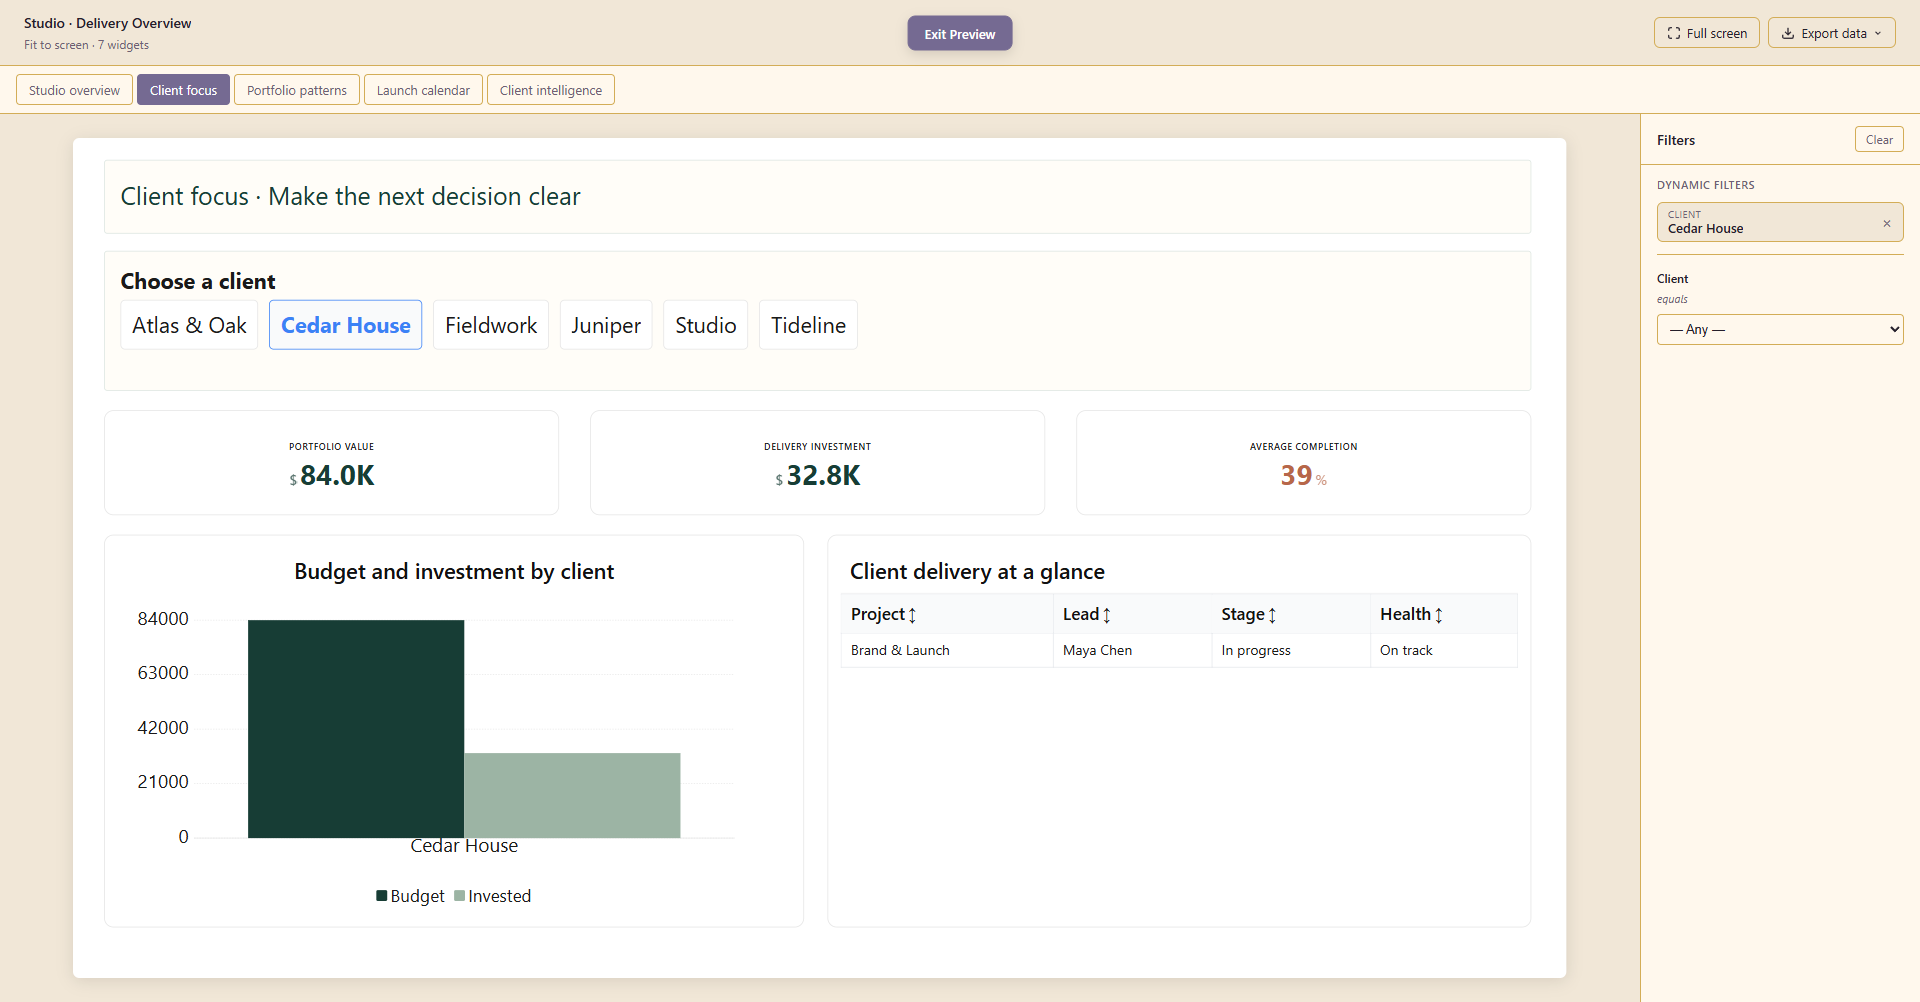
Select a client in a chart to focus the connected measures, charts and delivery records on that client.

Select Cedar House in the chart to focus the measures and underlying delivery record
Highlights · 04

Paginated reports

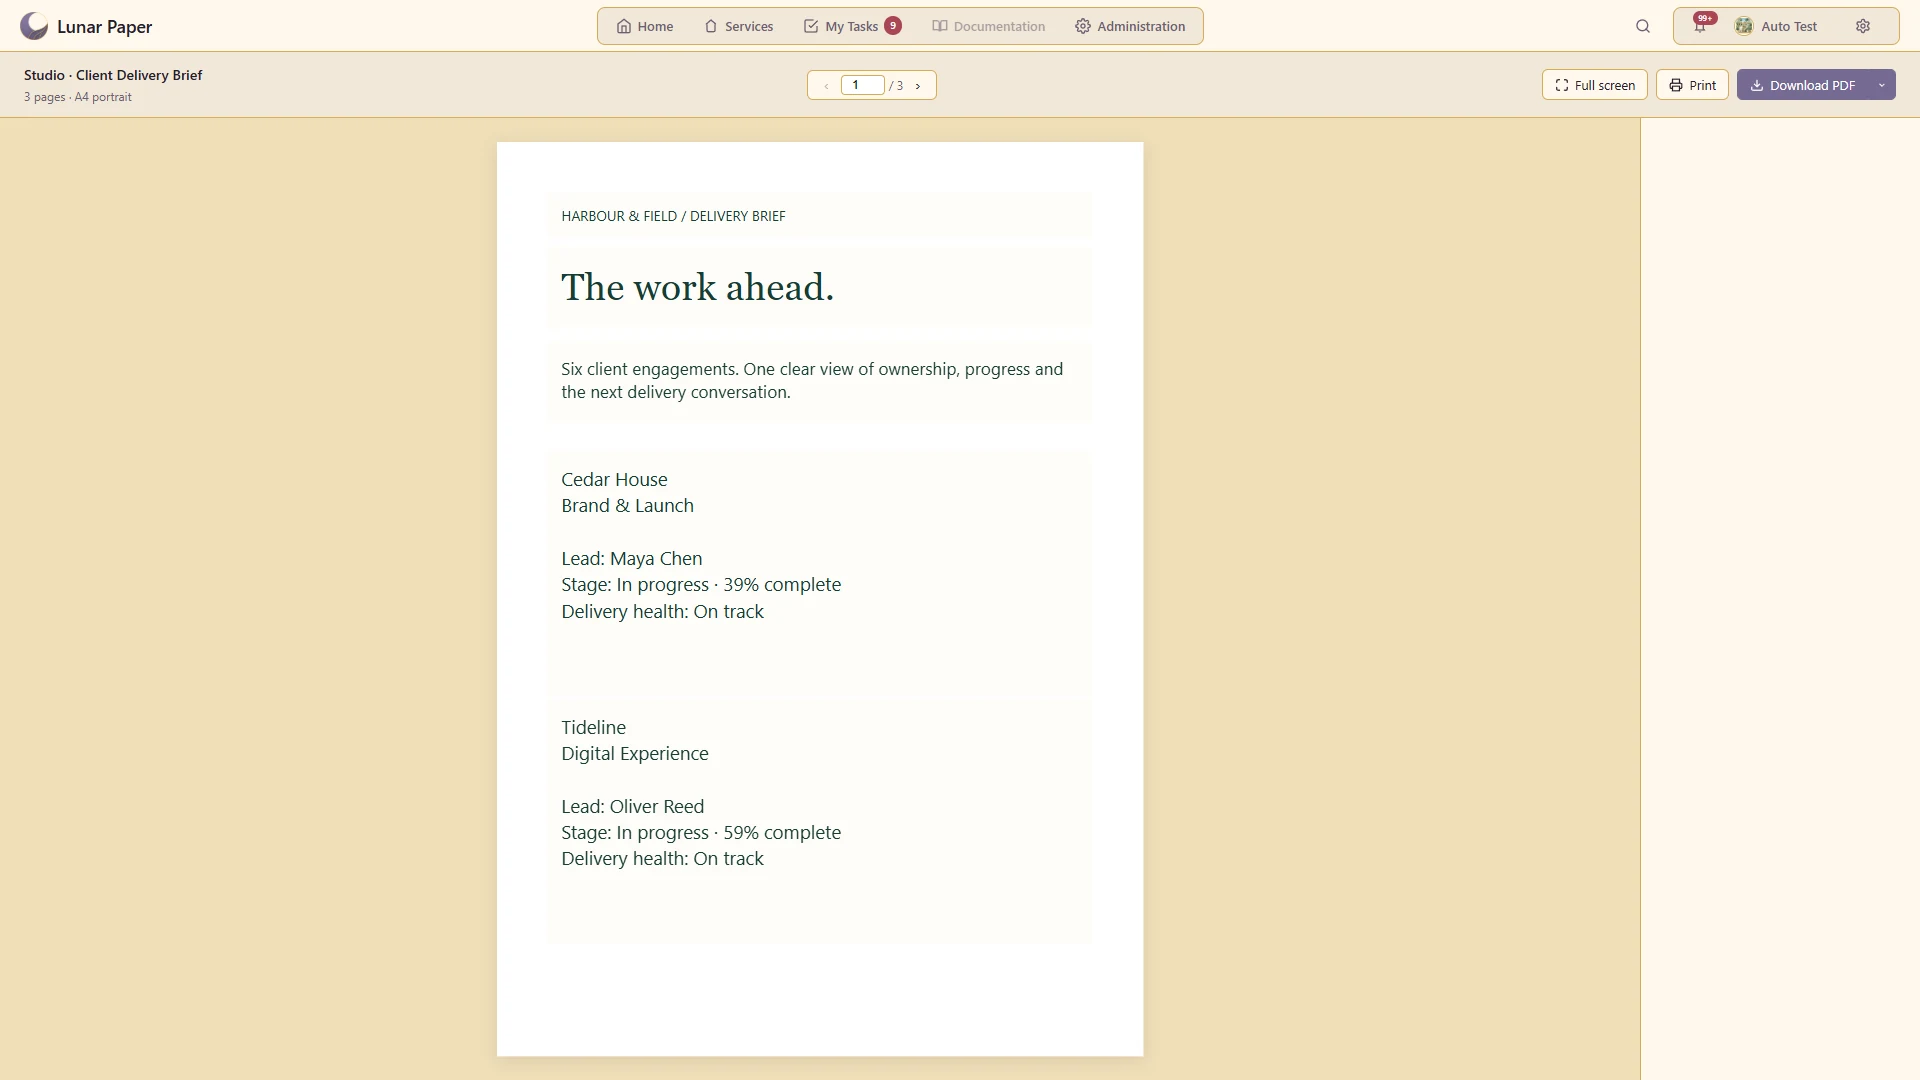
Design a paper-sized report with repeating content for a multi-page output.

Turn six live client engagements into a three-page A4 delivery brief
Highlights · 05

Scheduled report delivery

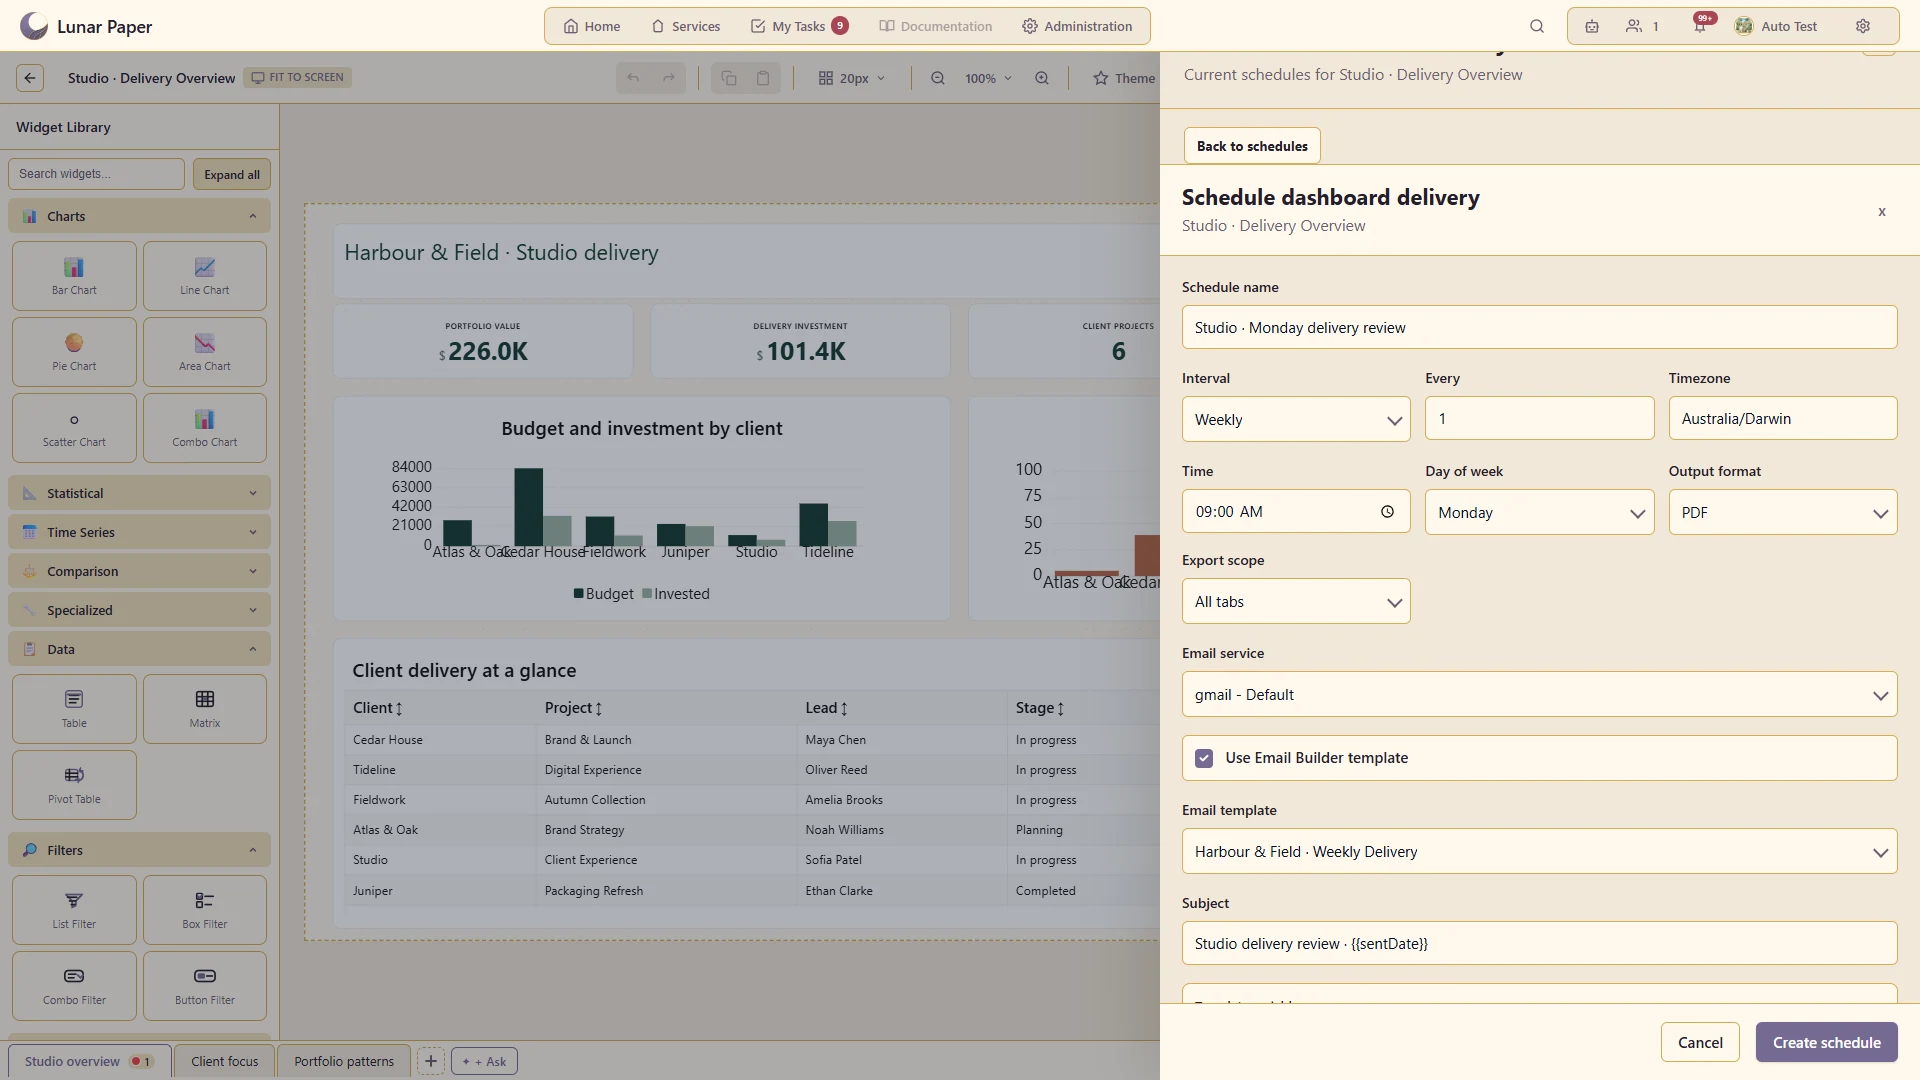
Configure a report schedule and the email used to deliver it.

Prepare a Monday PDF delivery at 9 am using the studio’s branded email template

A closer look

06 — 20
A closer look · 06

Data field mapping

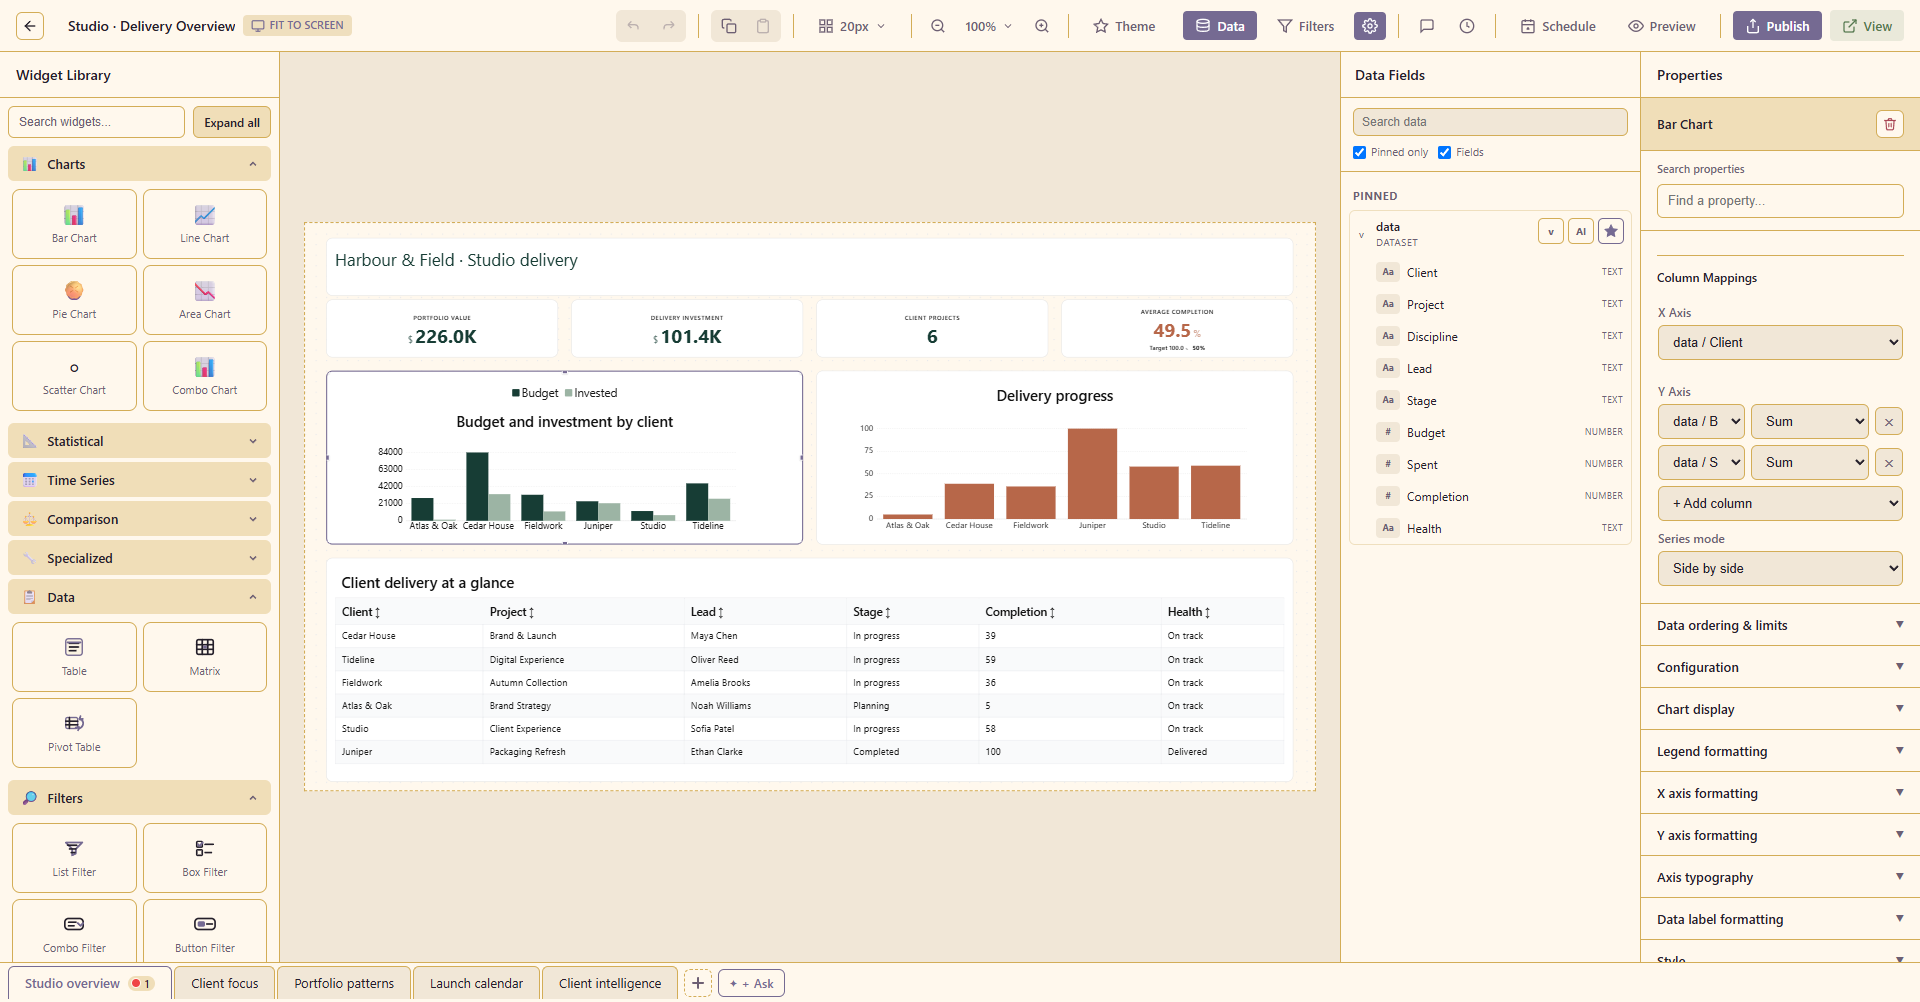
Bind a widget to a dataset and assign its category, series and value fields.

Map Client to the category axis and compare summed Budget and Spent measures
A closer look · 07

KPI and indicator widgets

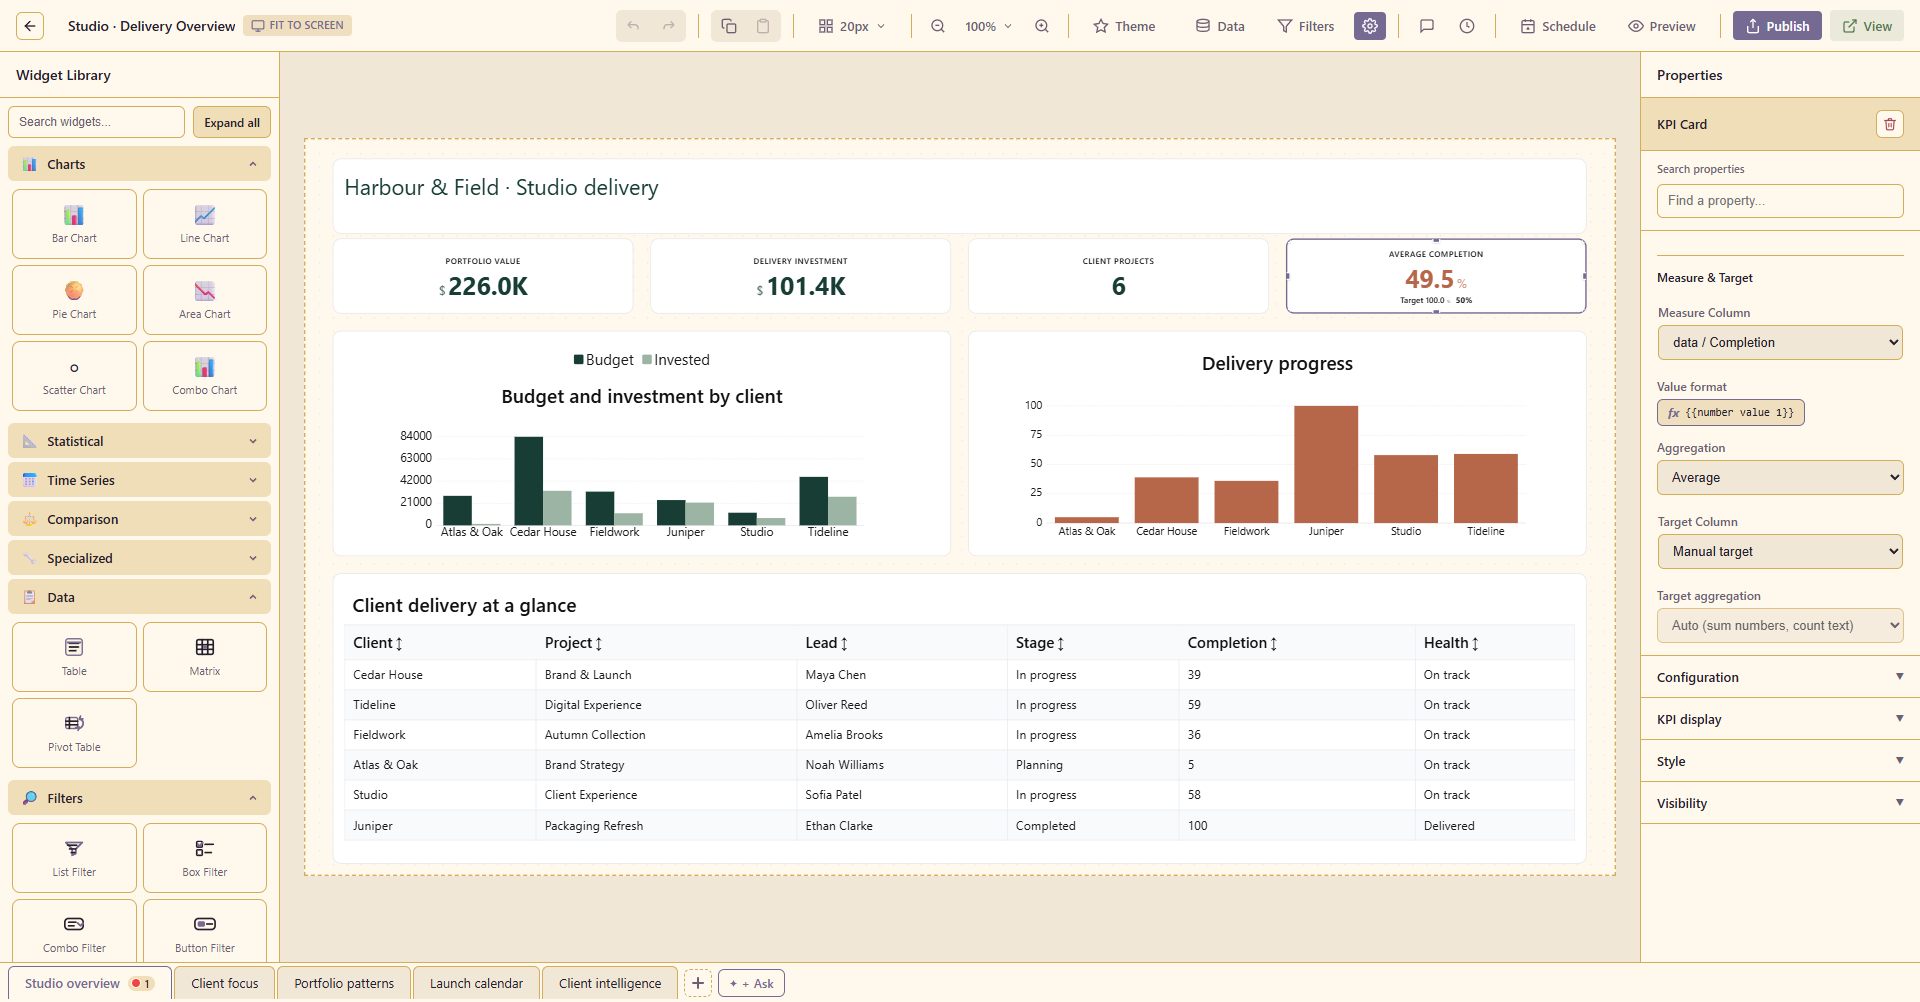
Present key values using numbers, gauges, progress or sparklines.

Bind average completion to the live delivery dataset and a 100 percent target
A closer look · 08

Statistical and time-series charts

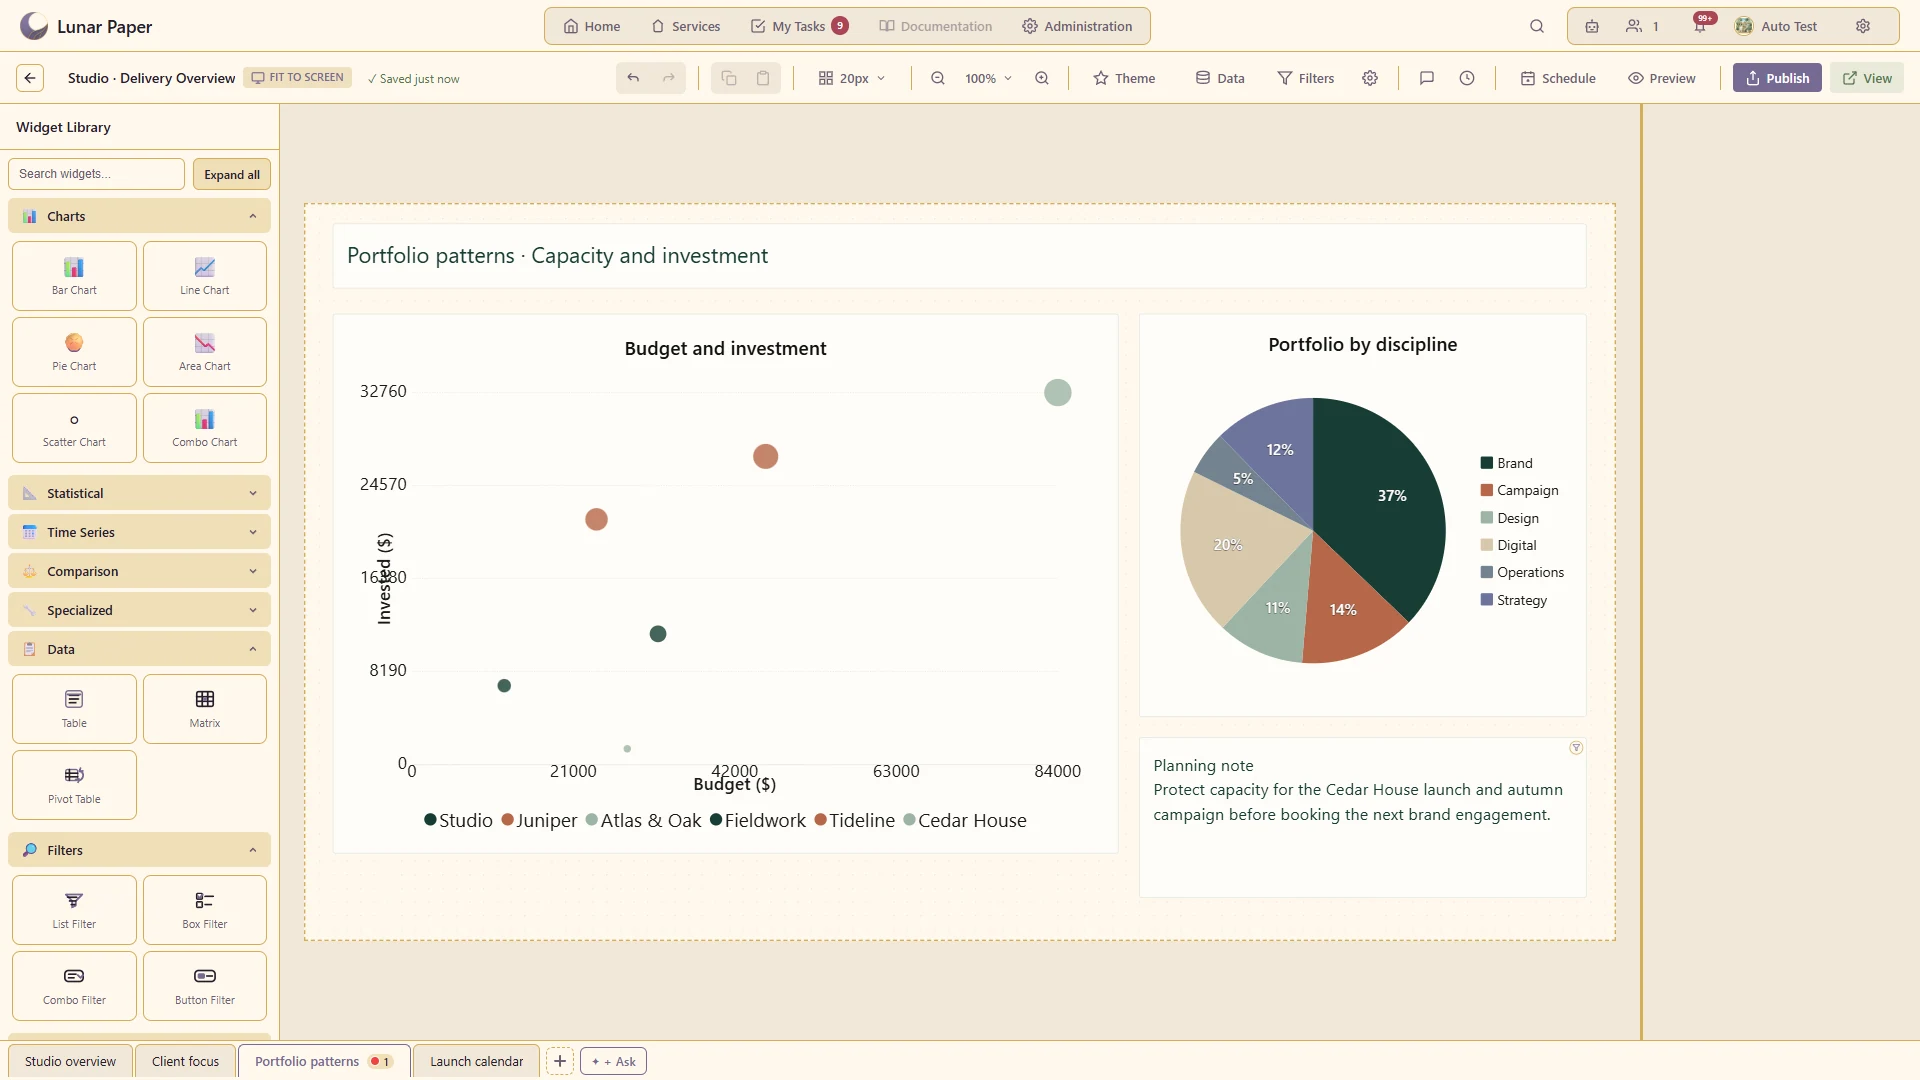
Choose a visual form that answers a question beyond a simple bar chart.

Compare budget with investment and see the mix of studio disciplines
A closer look · 09

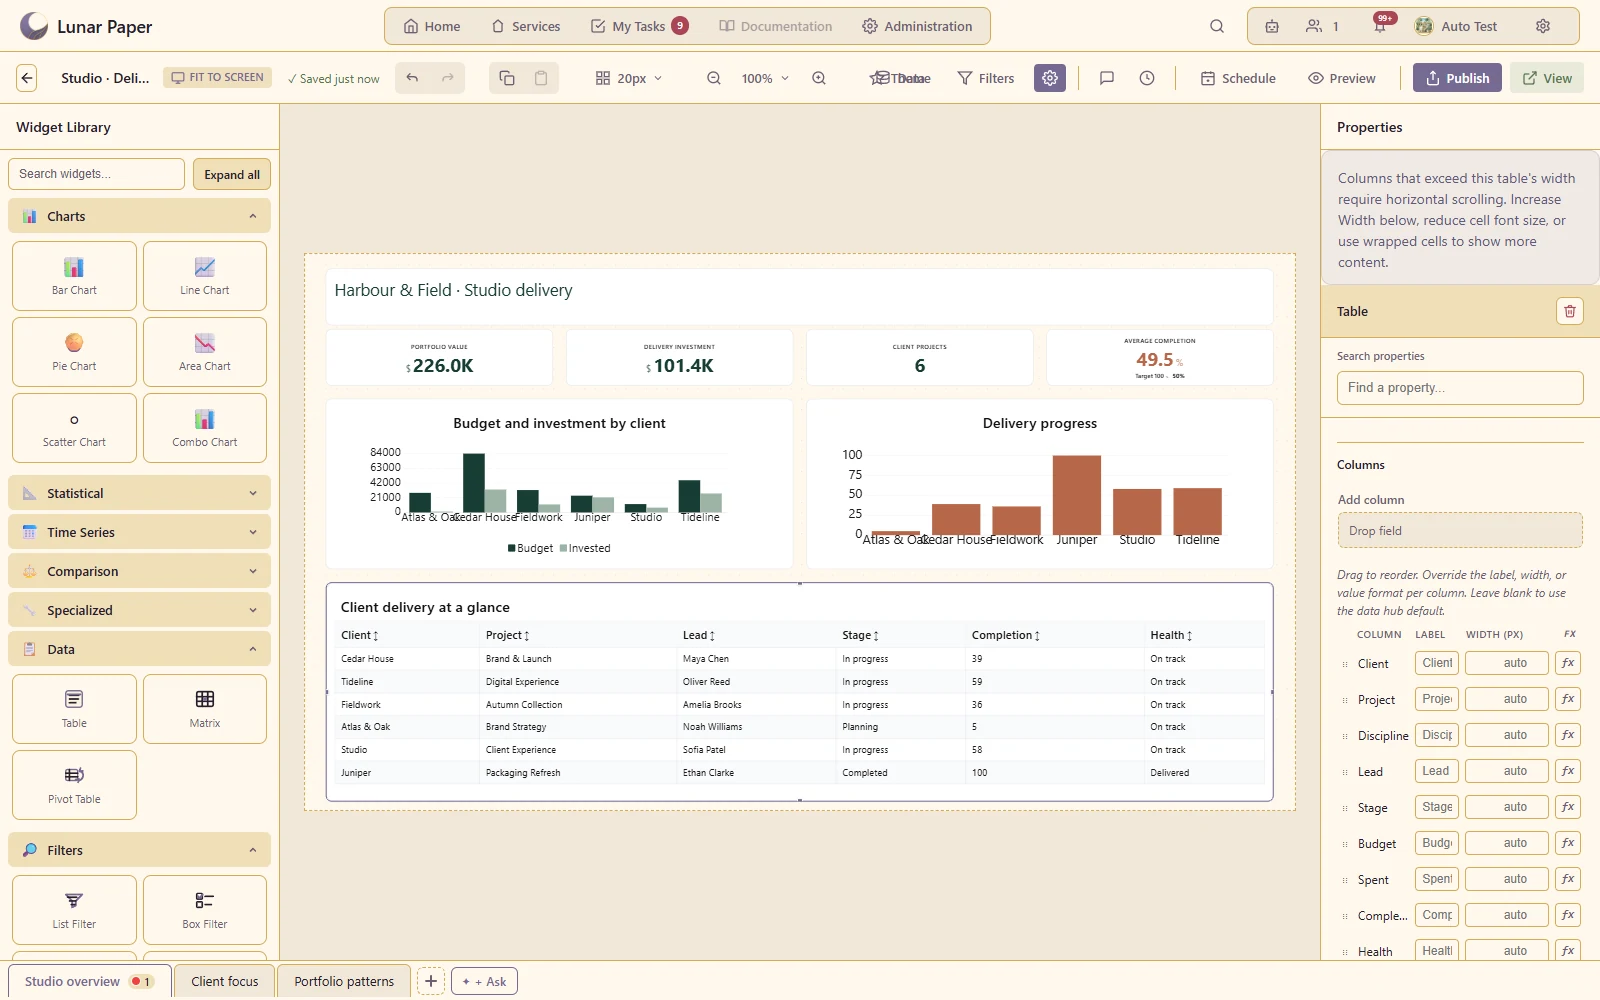
Tables, matrices and pivots

Compare detailed records and cross-tabulated measures in the same reporting environment.

Review named client records and tune the table’s column labels, widths and formats
A closer look · 10

Multiple dashboard tabs

Separate audiences or topics while retaining one dashboard document.

Separate the studio overview, client focus and portfolio patterns in one dashboard
A closer look · 11

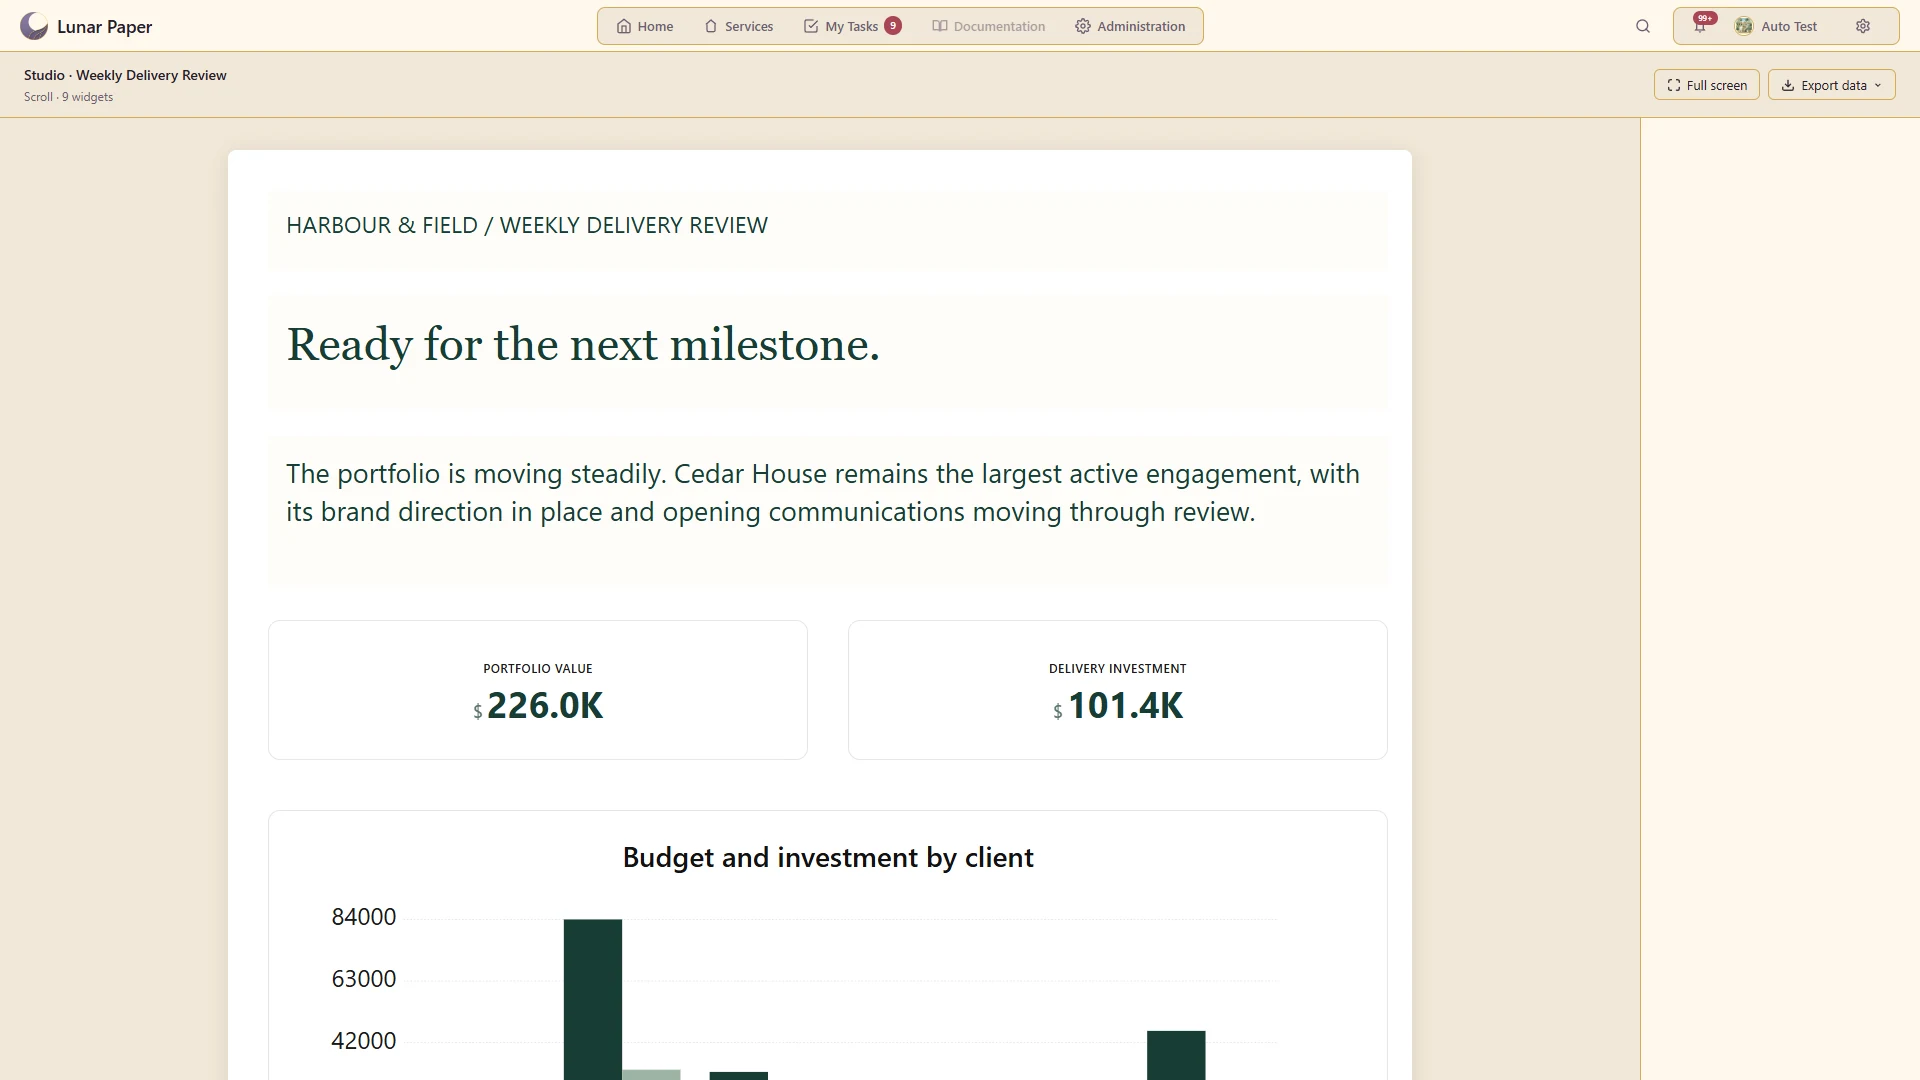
Scrollable reports

Build a continuous report when the content needs more room than a fixed dashboard.

Combine a delivery narrative, live measures and detailed records in a continuous weekly report
A closer look · 12

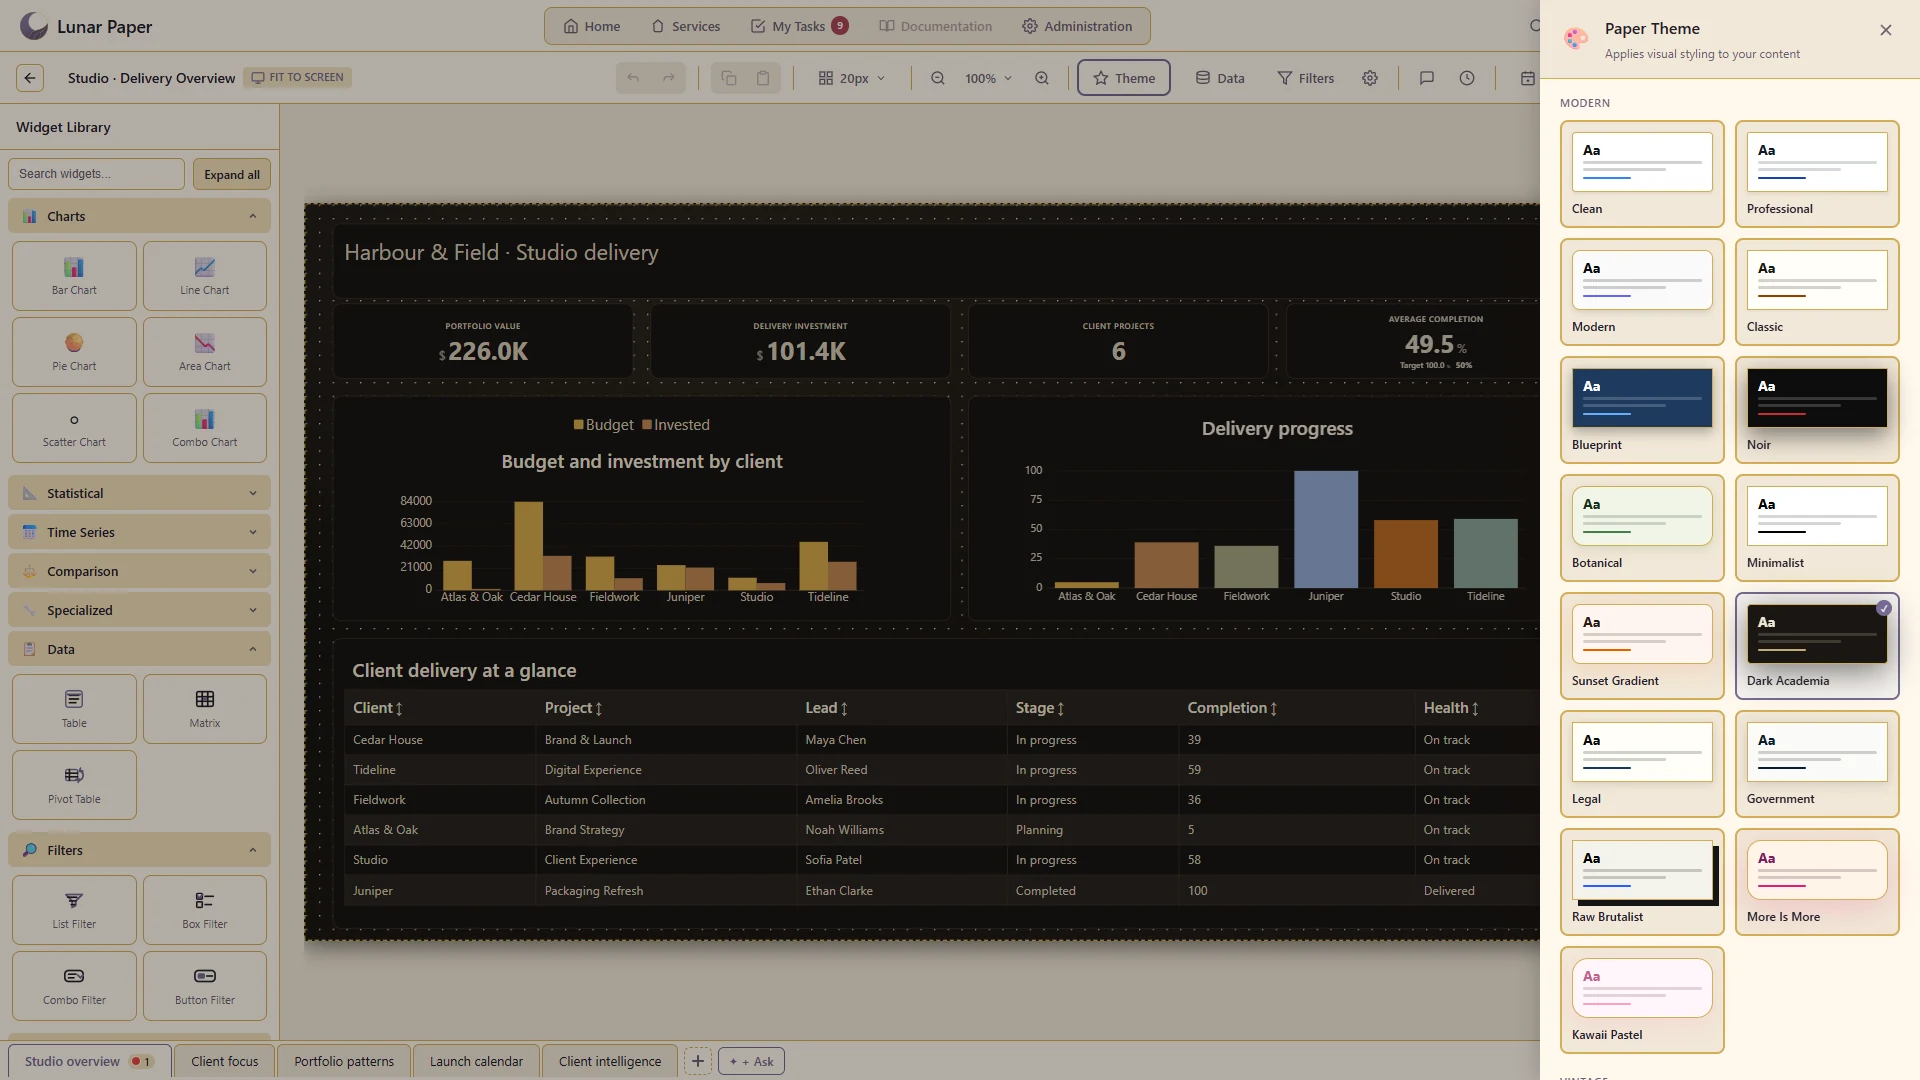
Paper themes and page settings

Match presentation, dimensions and margins to the report's intended use.

Apply the Dark Academia paper theme to every card, chart and table on the studio overview
A closer look · 13

Repeating report regions

Lay out repeated data-driven content without copying each record by hand.

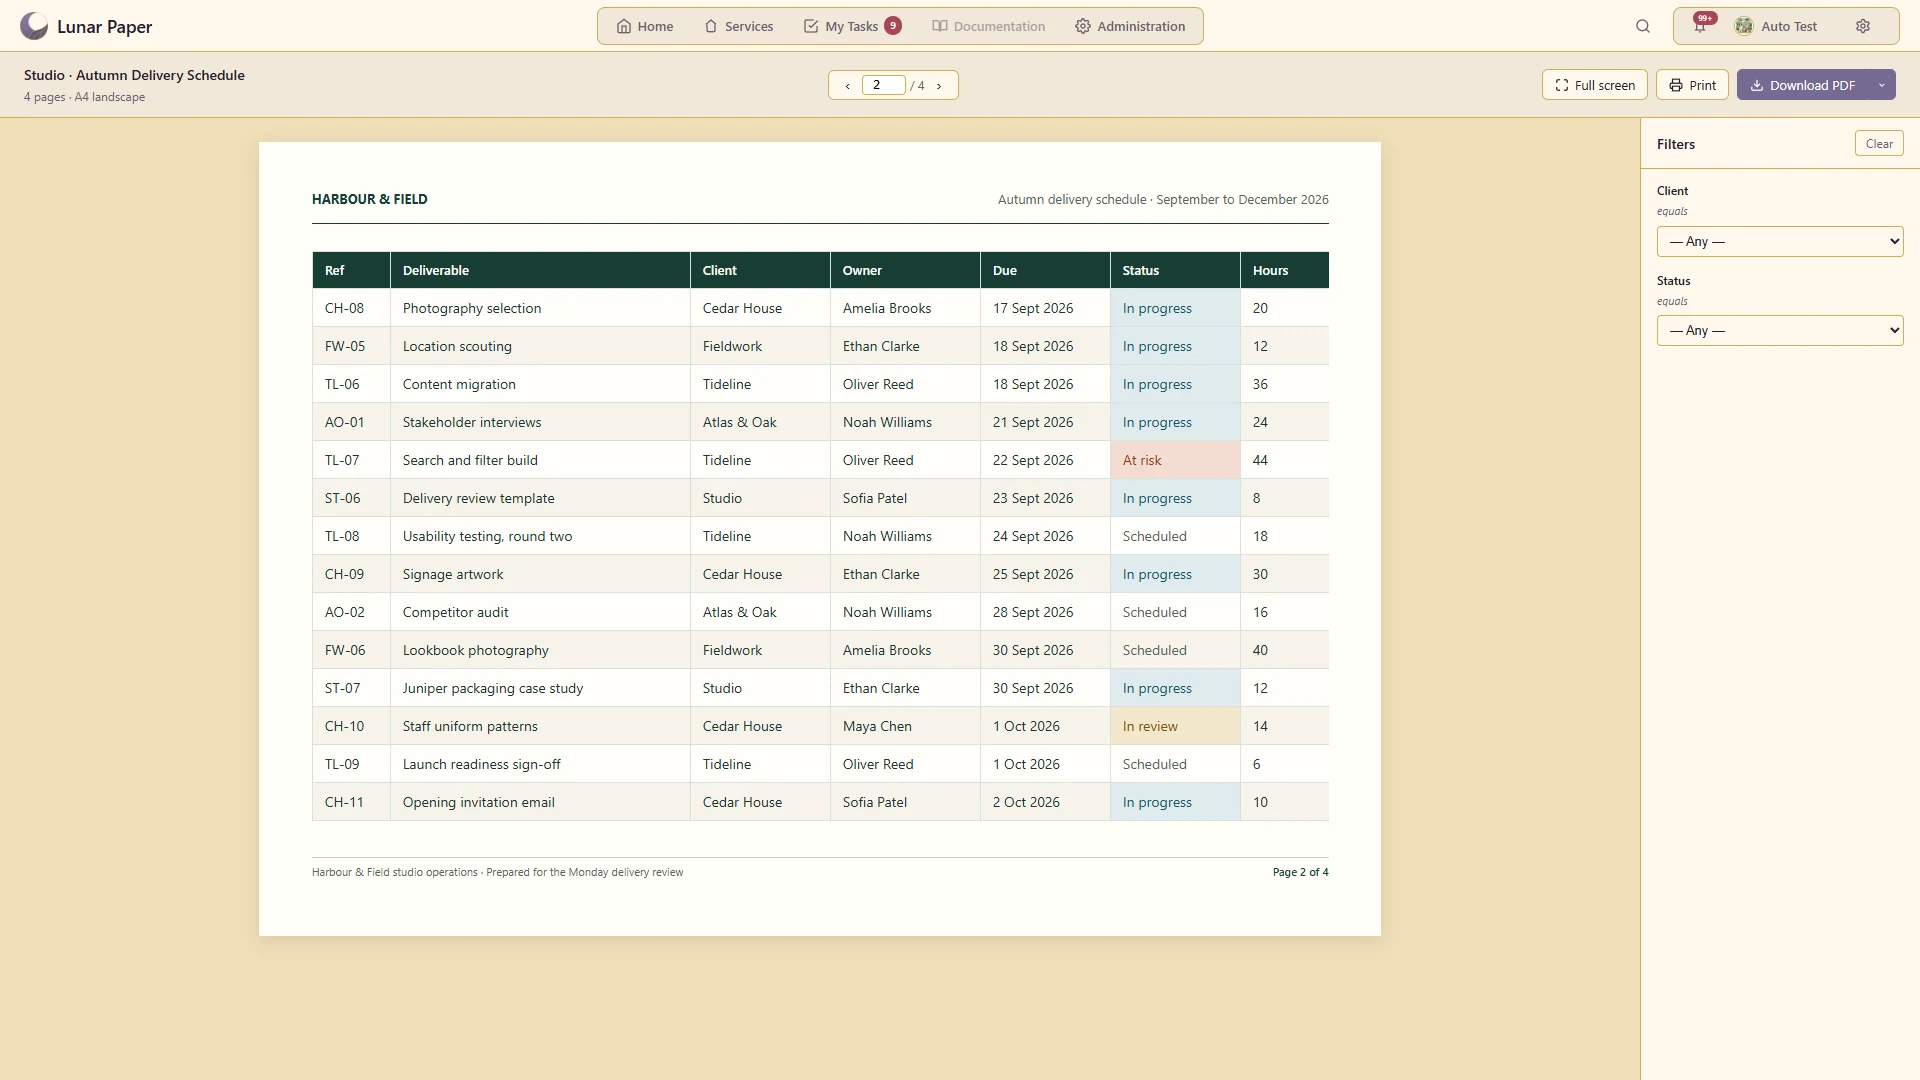
Carry 52 deliverables over four A4 pages, with the page header, column titles and footer repeated on every page
A closer look · 14

Date grouping and fiscal periods

Group measures by configured date parts and reporting periods.

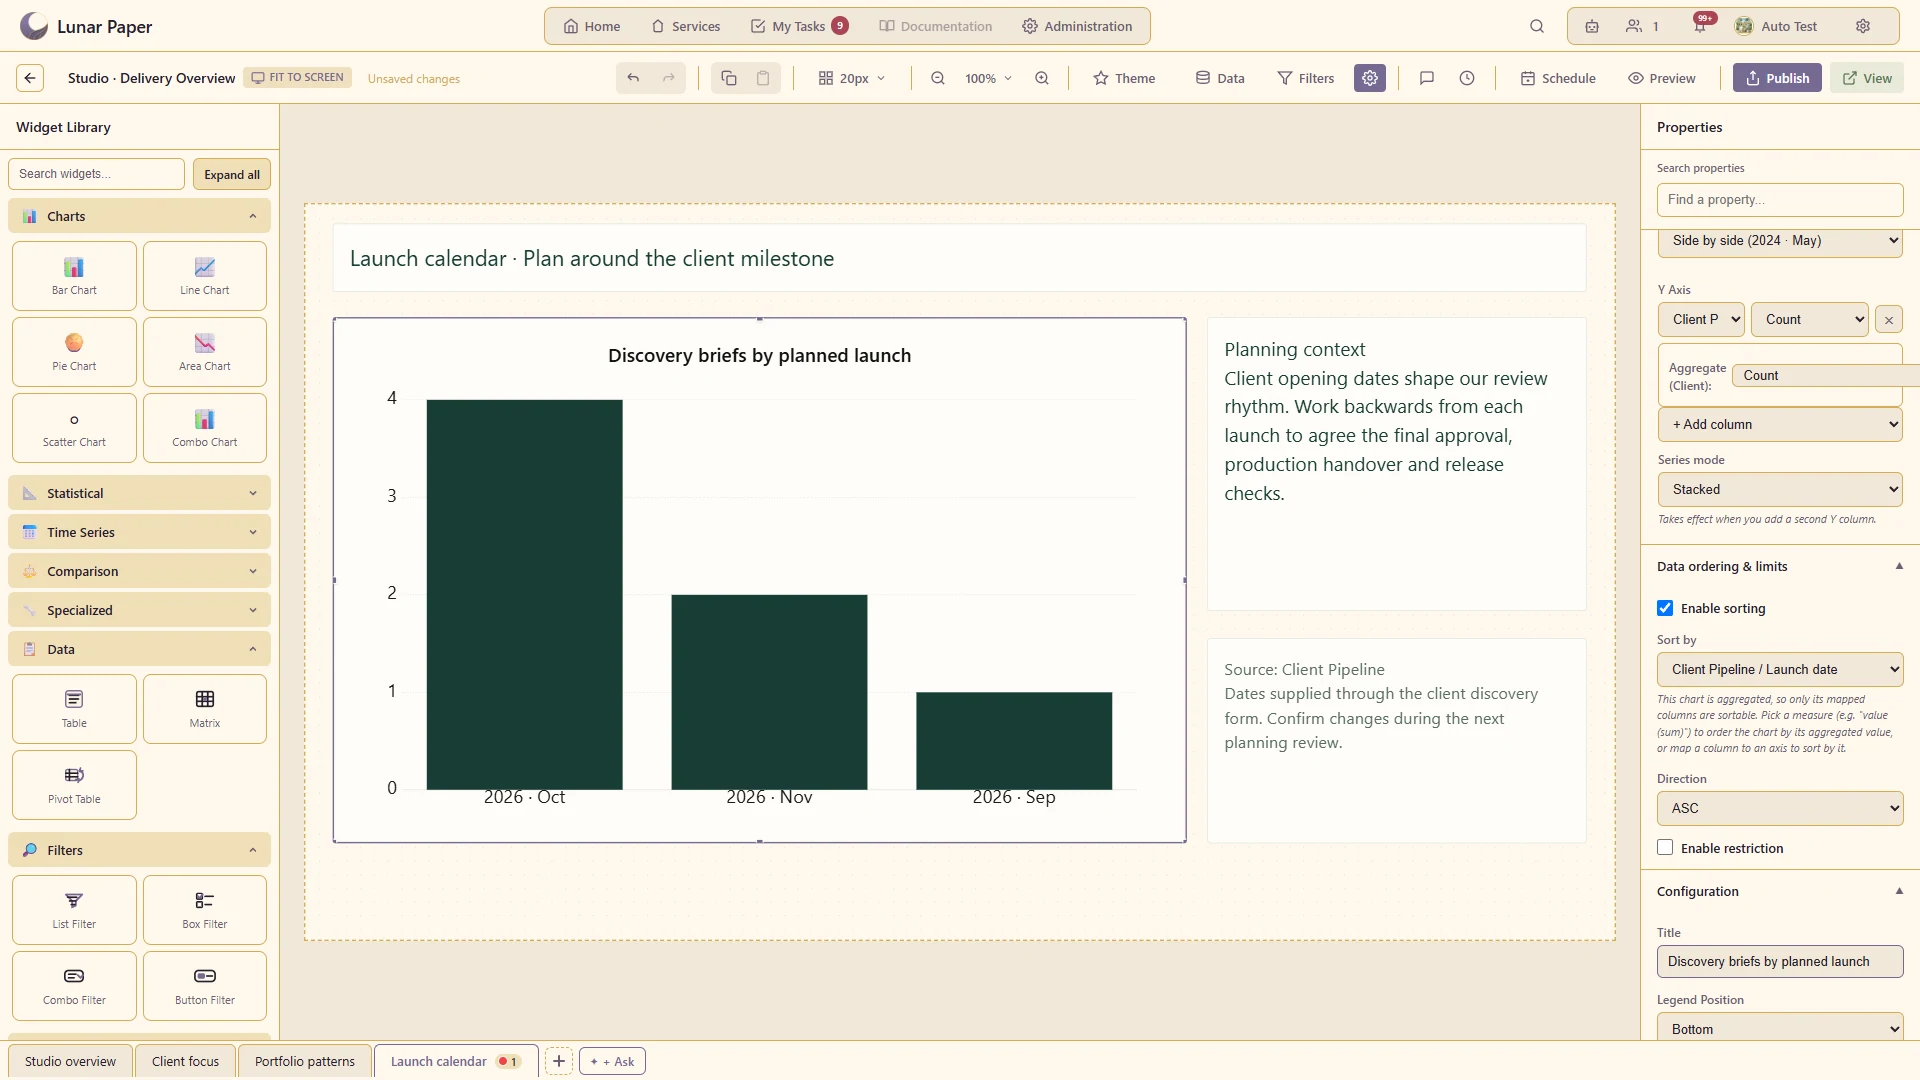
Group discovery briefs by launch year and month, with chronological ordering
A closer look · 15

Number and value formatting

Make currencies, percentages and other measures readable in each widget.

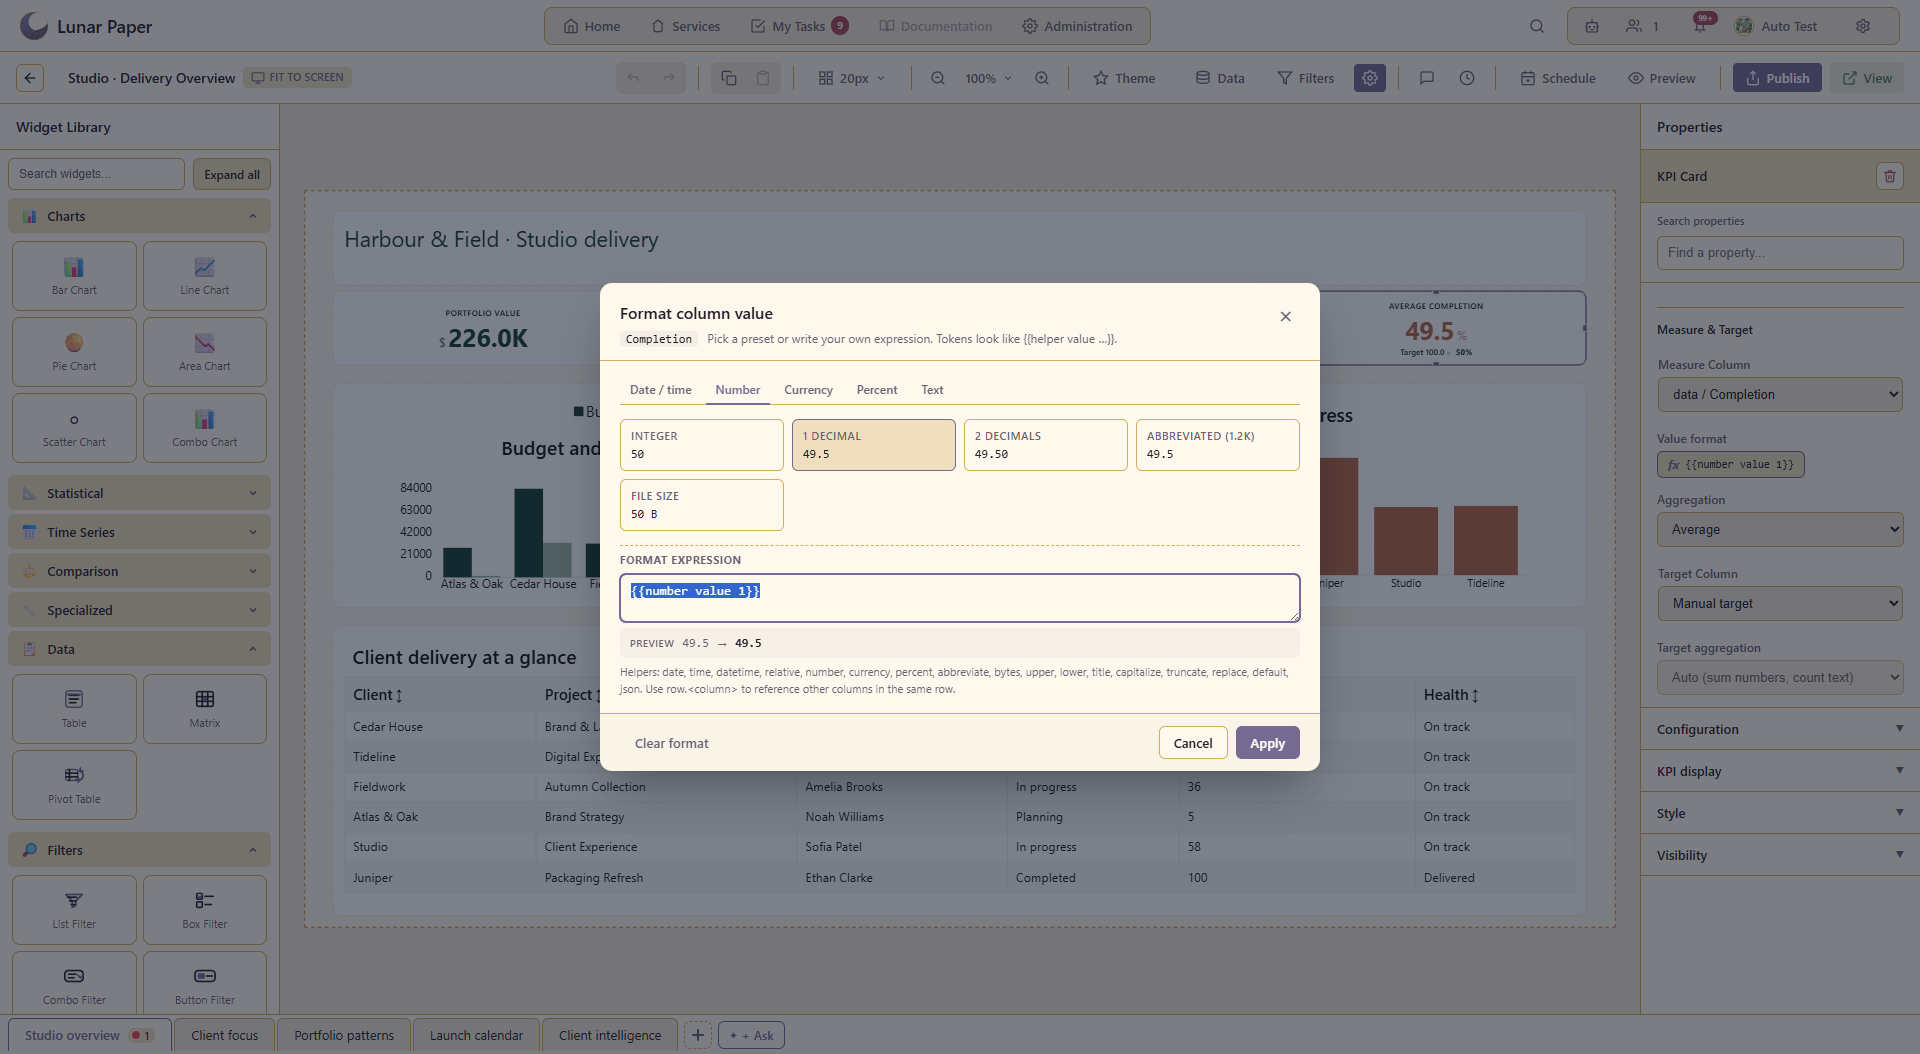
Preview a consistent one-decimal format for the completion measure
A closer look · 16

Conditional widget visibility

Show the relevant report elements under the configured visibility rules.

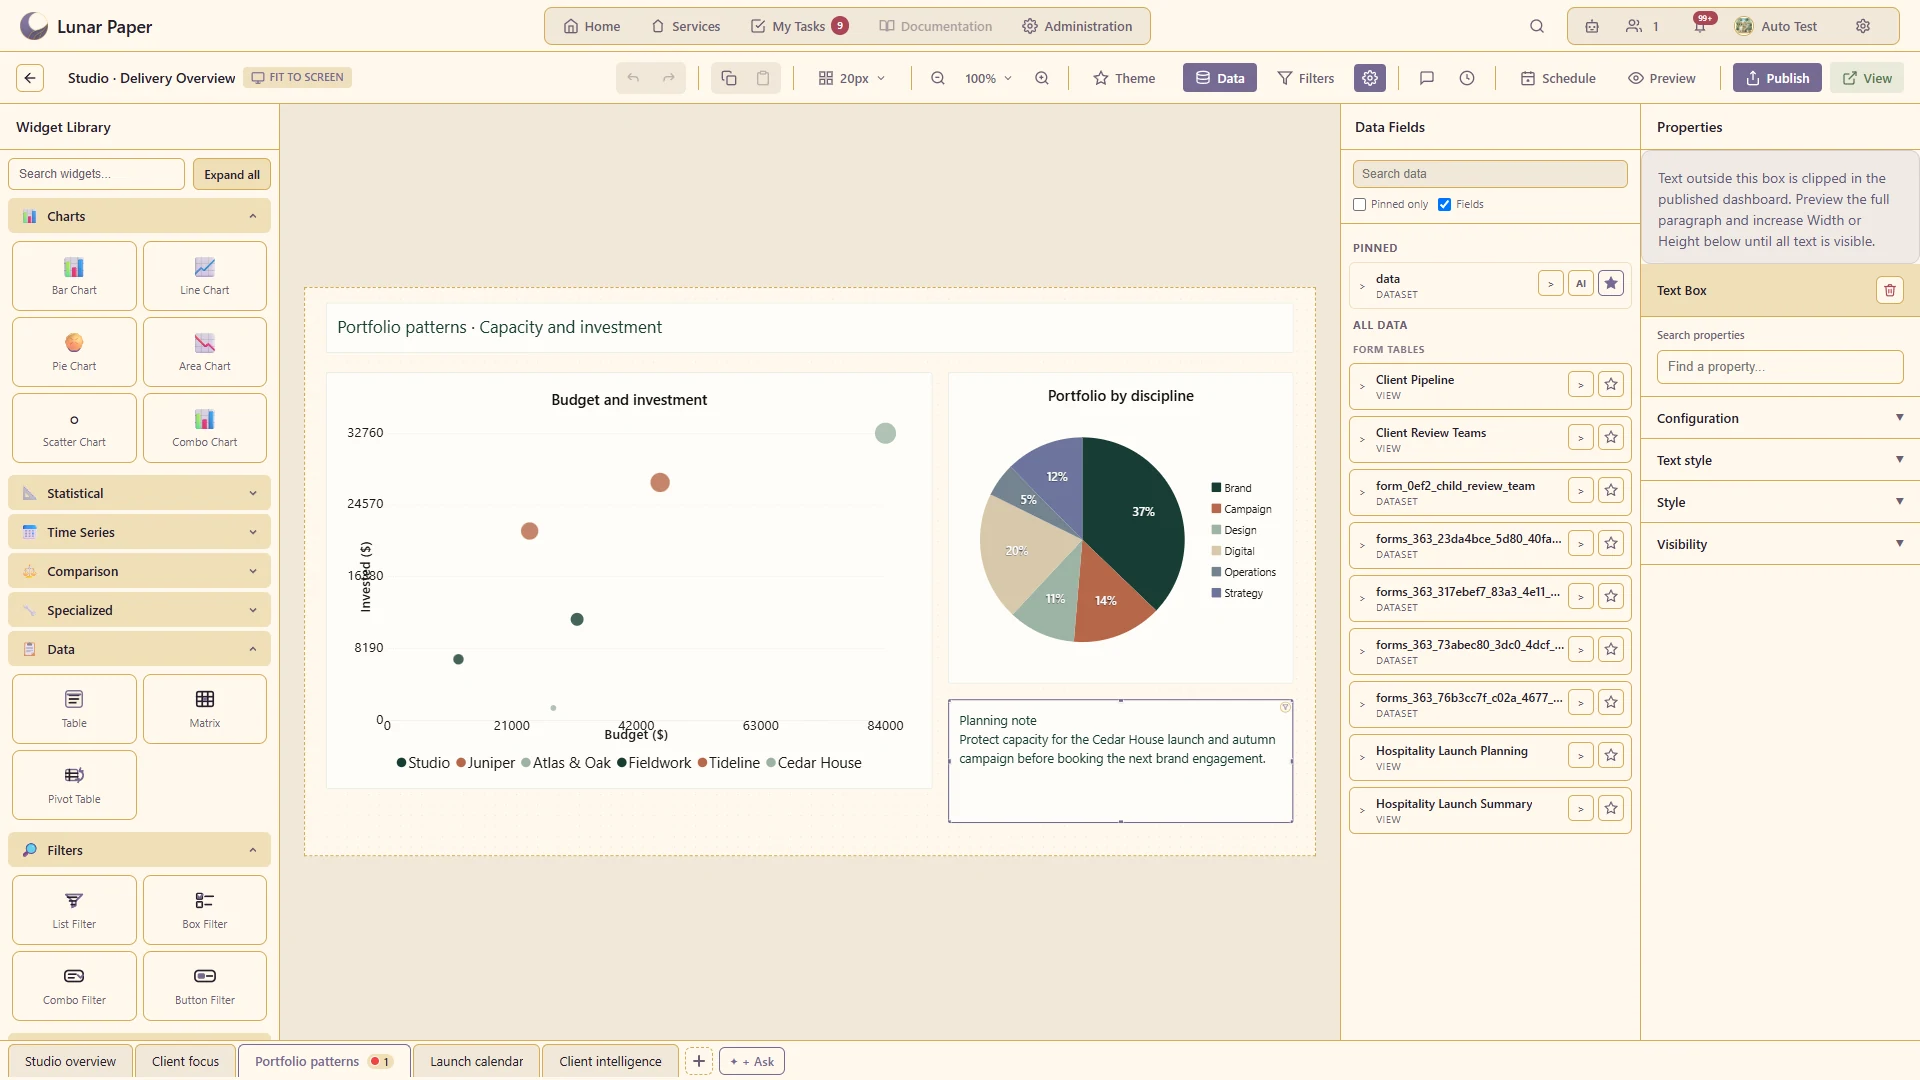
Show the portfolio-wide planning note only while no individual client filter is set.
A closer look · 17

Layout and annotation elements

Add headings, explanatory text, images, shapes and callouts around the data.

Combine a delivery narrative, live measures and detailed records in a continuous weekly report
A closer look · 18

PDF and data export

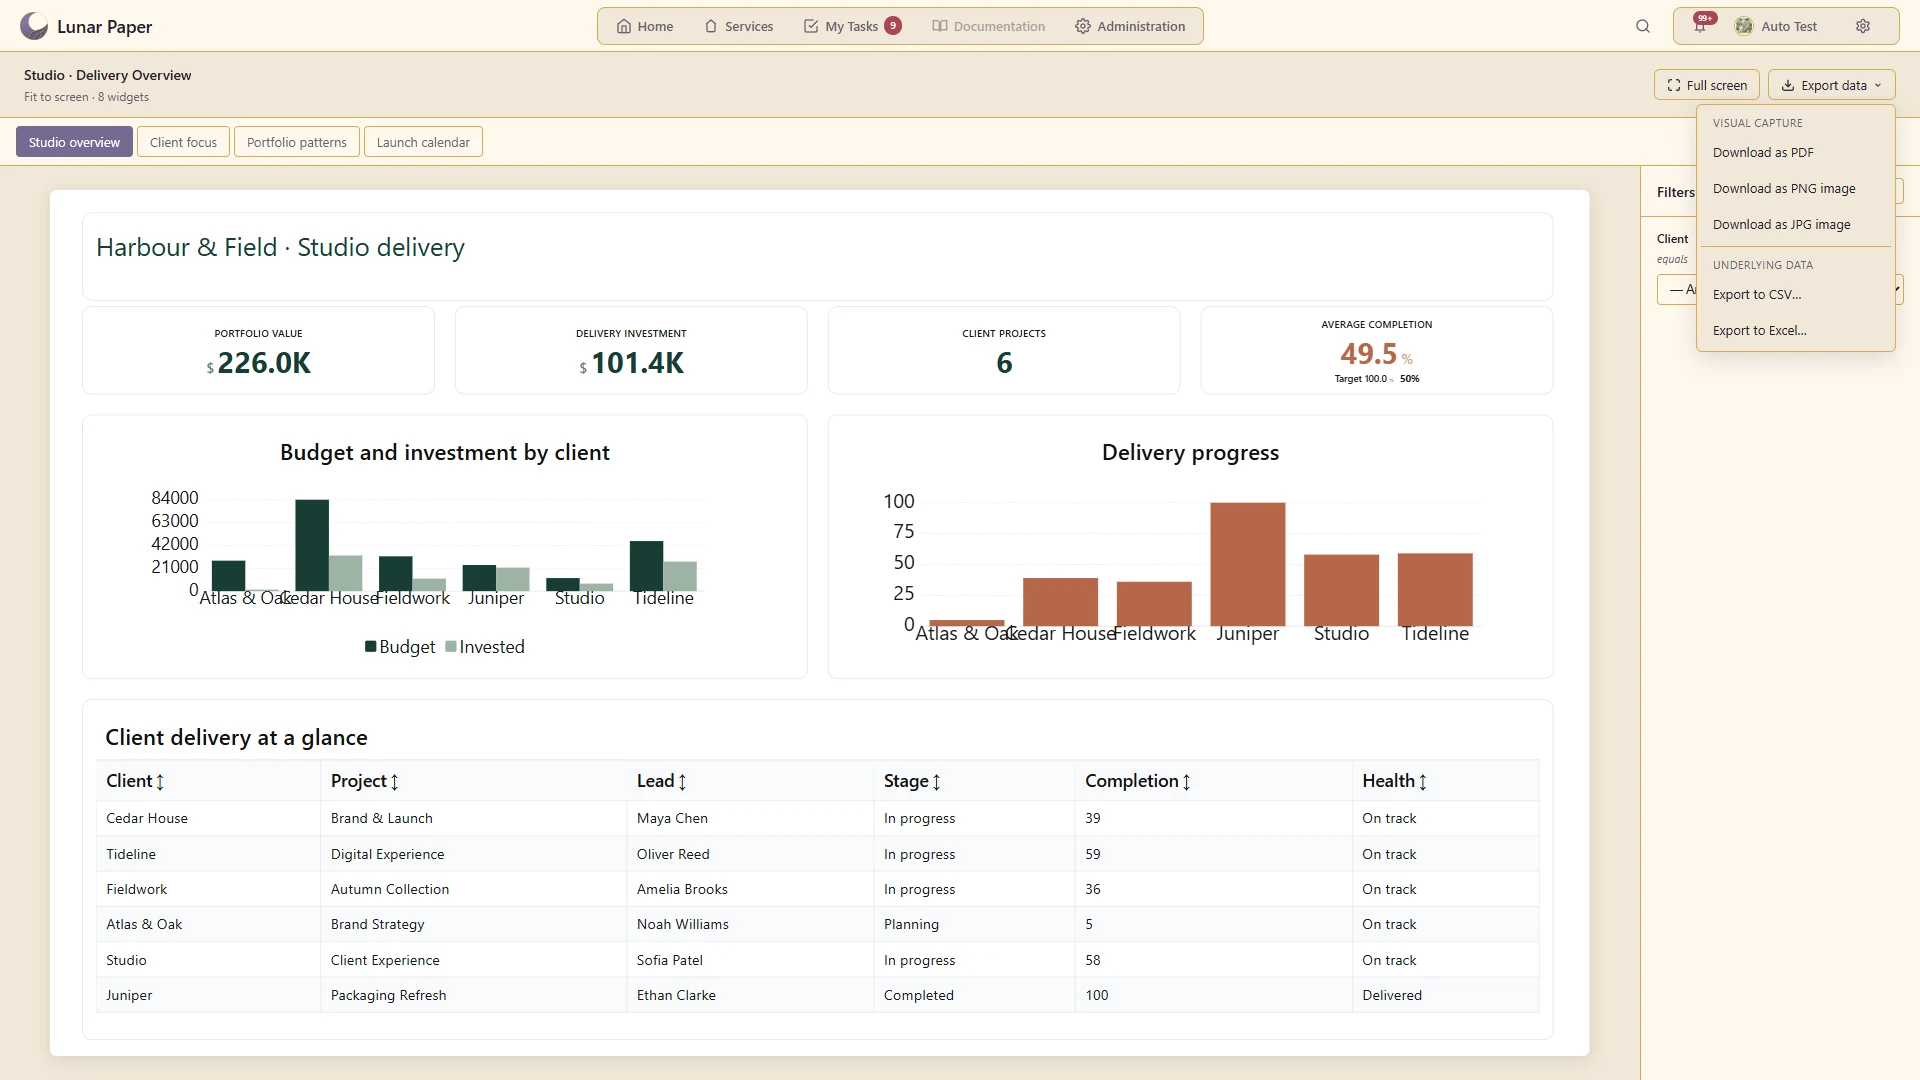
Produce a distributable report and export supporting data where available.

Export the published studio report’s supporting data for use in another tool
A closer look · 19

Published access and versions

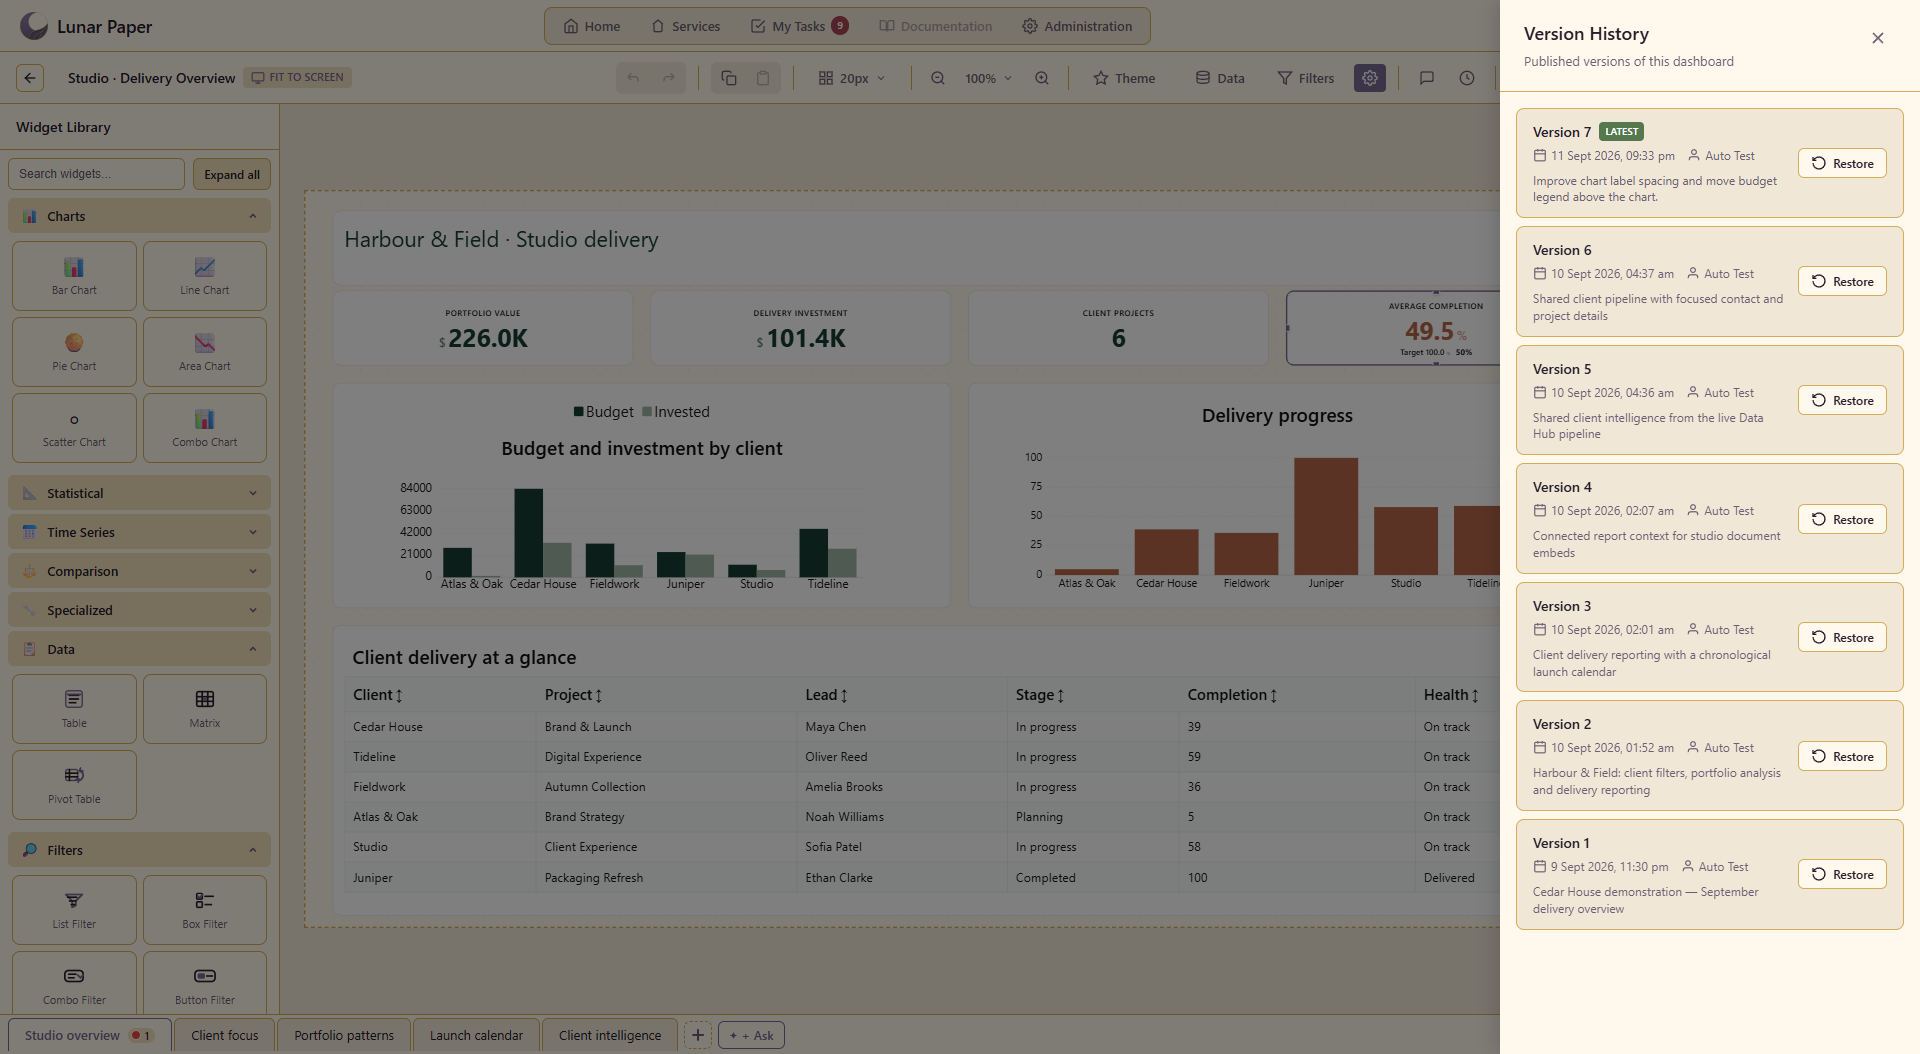
Share a saved dashboard through the supported audience and version controls.

Keep the original overview and the expanded client reporting release in version history
A closer look · 20

View analytics and delivery history

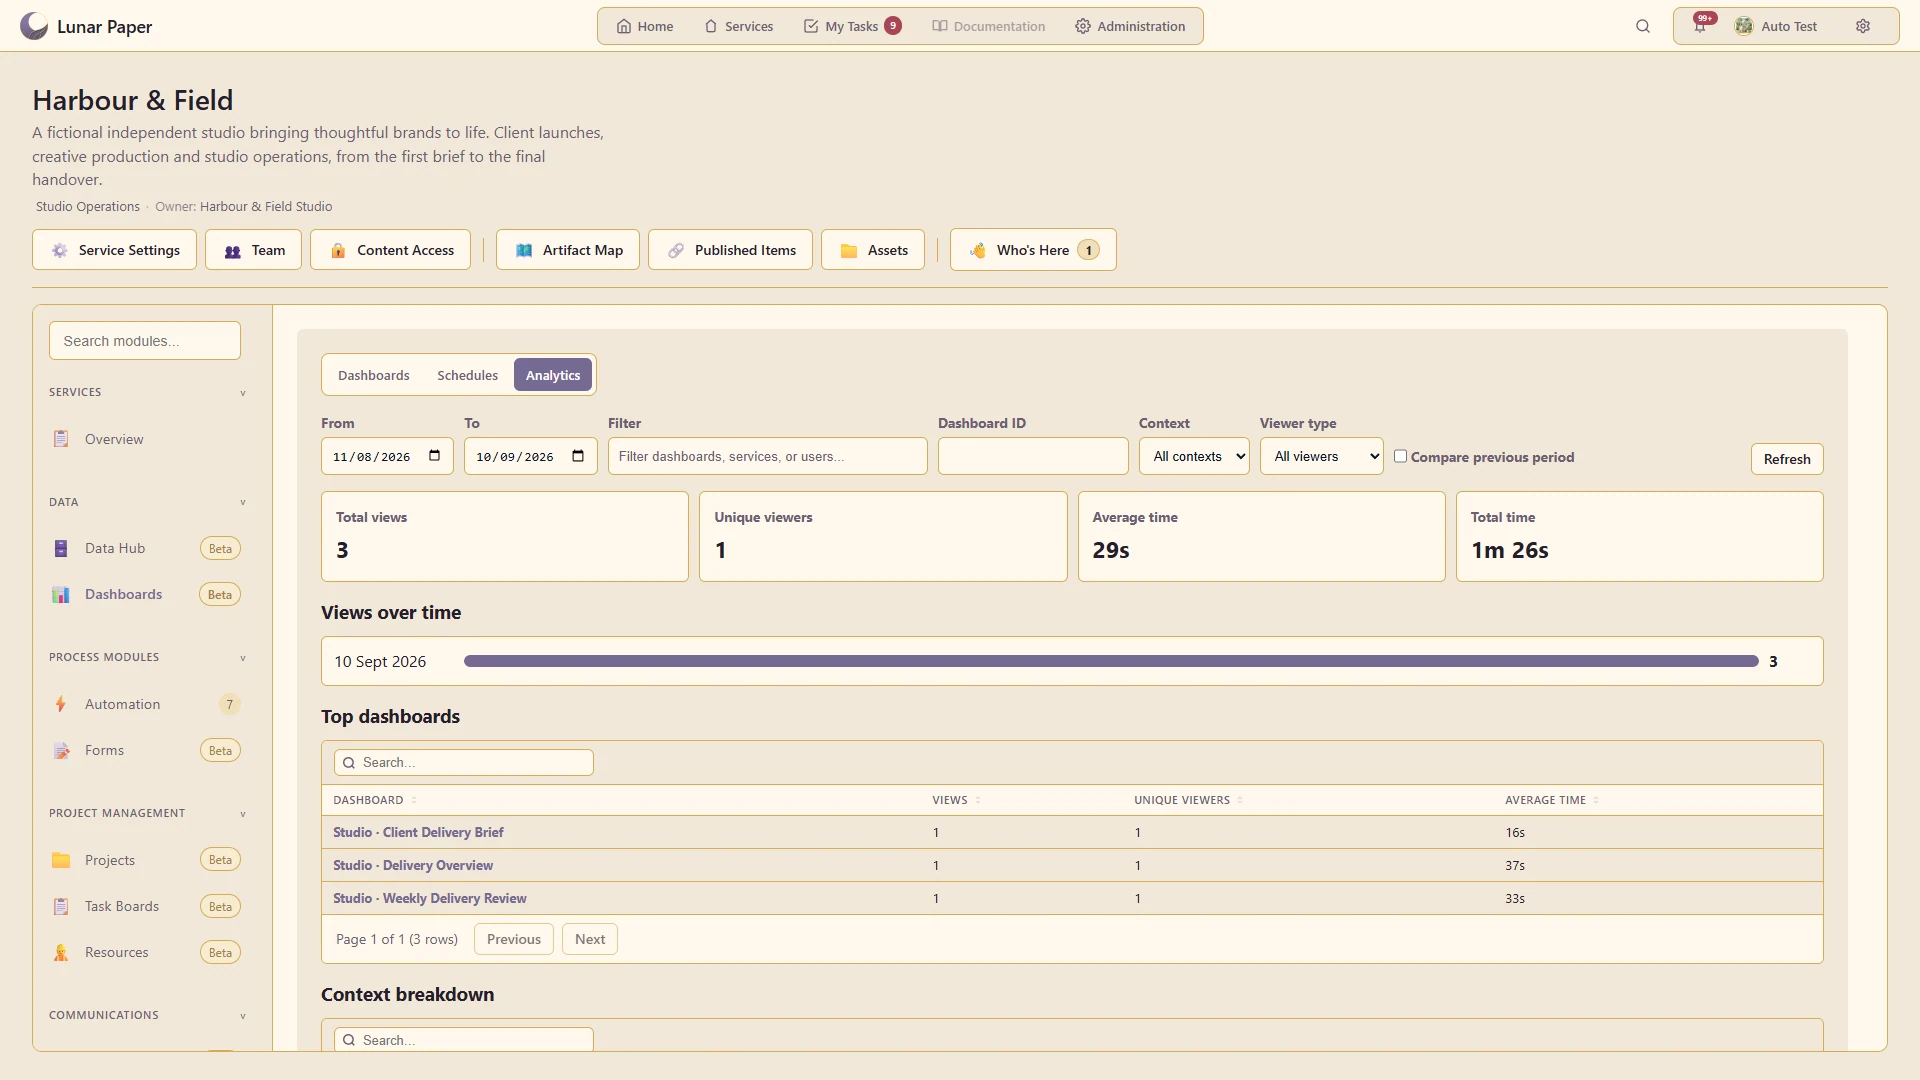
Review dashboard use and the outcome of scheduled report runs.

Review real views of the studio’s published dashboards and delivery reports

Additional Details

The main areas Dashboards brings together.

Dashboard composition

Arrange reports, indicators, explanatory content and interactive controls in flexible dashboard layouts.

Charts and analysis

Use a broad range of charts, statistical views and indicators to explain performance and change.

Tables and detailed reporting

Present detailed records, summaries and cross-tabulated information alongside visual analysis.

Connected data

Bind dashboard elements to governed sources and shape fields, calculations and aggregations for reporting.

Exploration and interaction

Let viewers filter, inspect and move through information without losing the surrounding context.

Publishing and governance

Review, share, schedule and export dashboards with the controls needed for dependable distribution.

Get started

Try it on your own machine

Run the platform with all features for free for three people.