
Visual diagramming
Create flowcharts, maps and structured diagrams on a flexible canvas with reusable visual building blocks.
Turn processes, systems, plans and ideas into clear, structured diagrams. Charts and Flowcharts combines a visual canvas with specialist shape libraries, smart charts, process analysis, scenarios and multi-page publishing, so teams can map how work operates, test alternatives and share an agreed view.
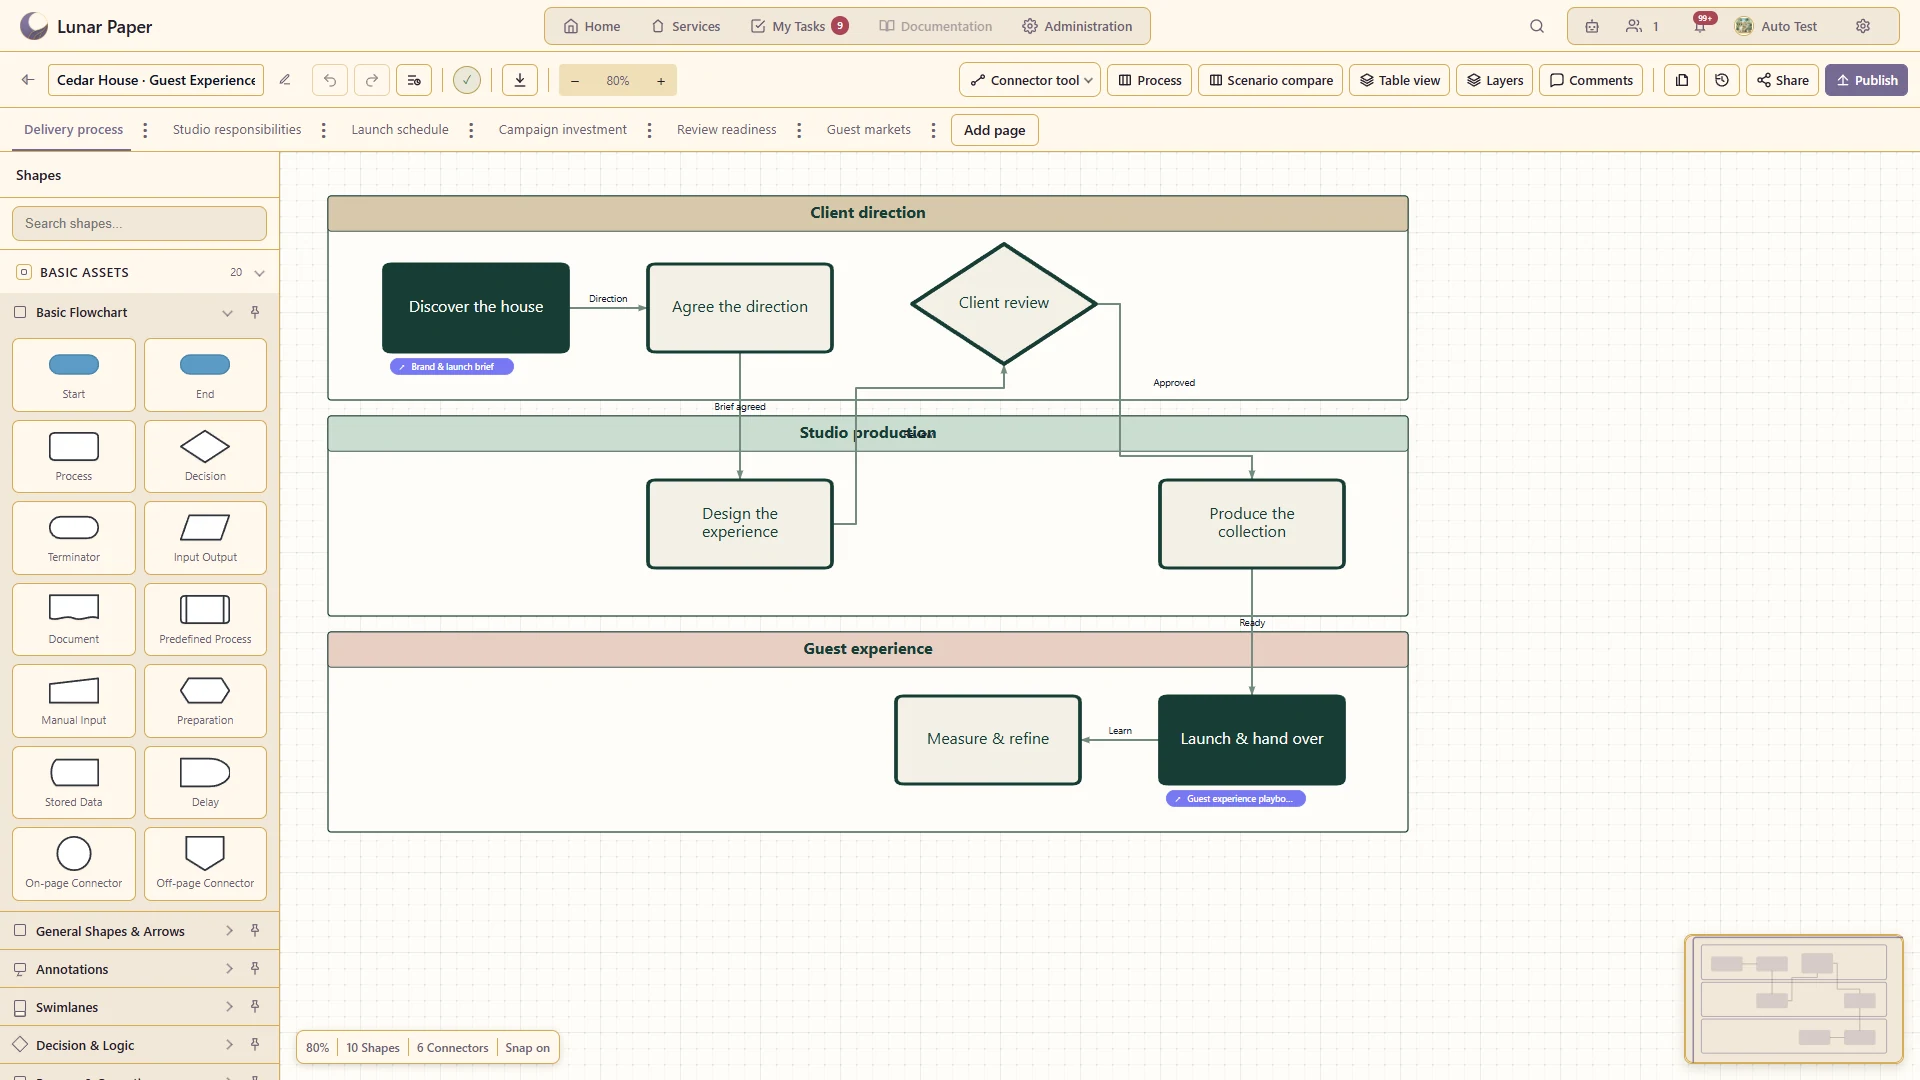
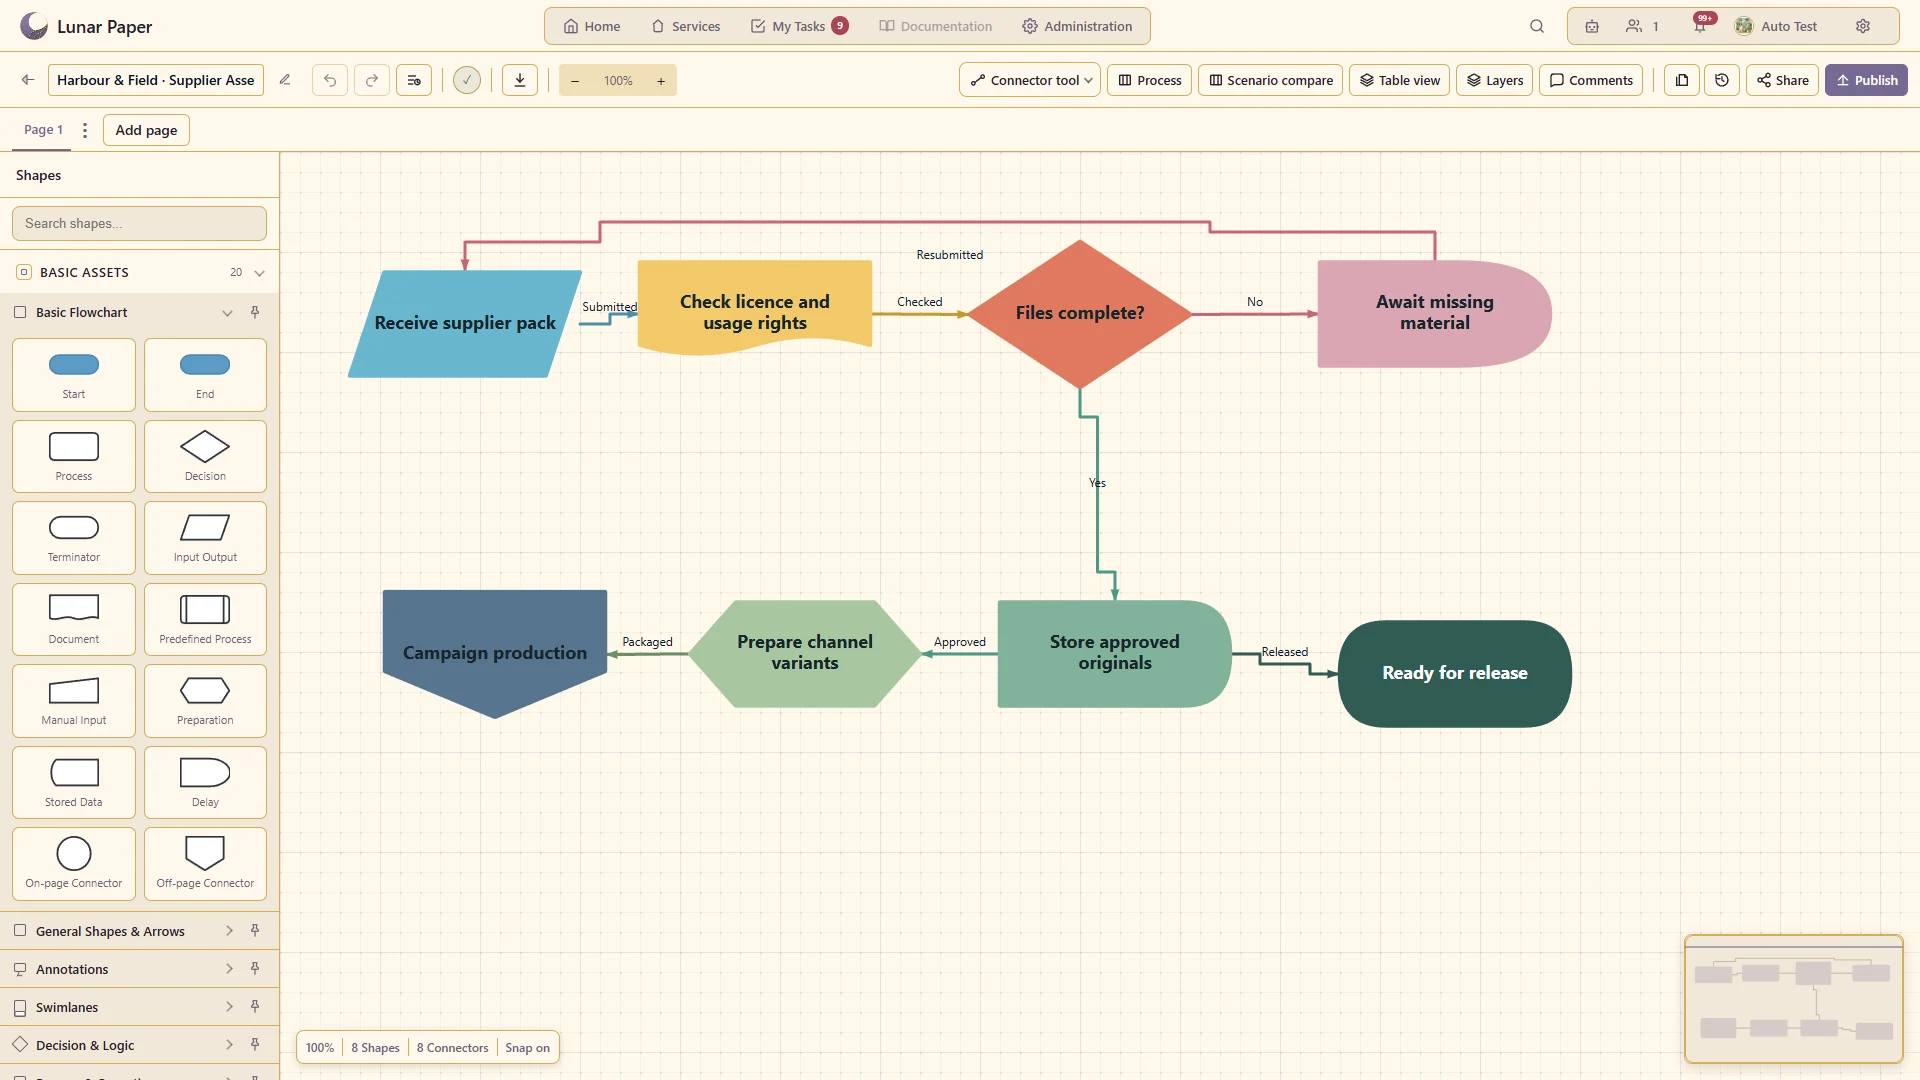
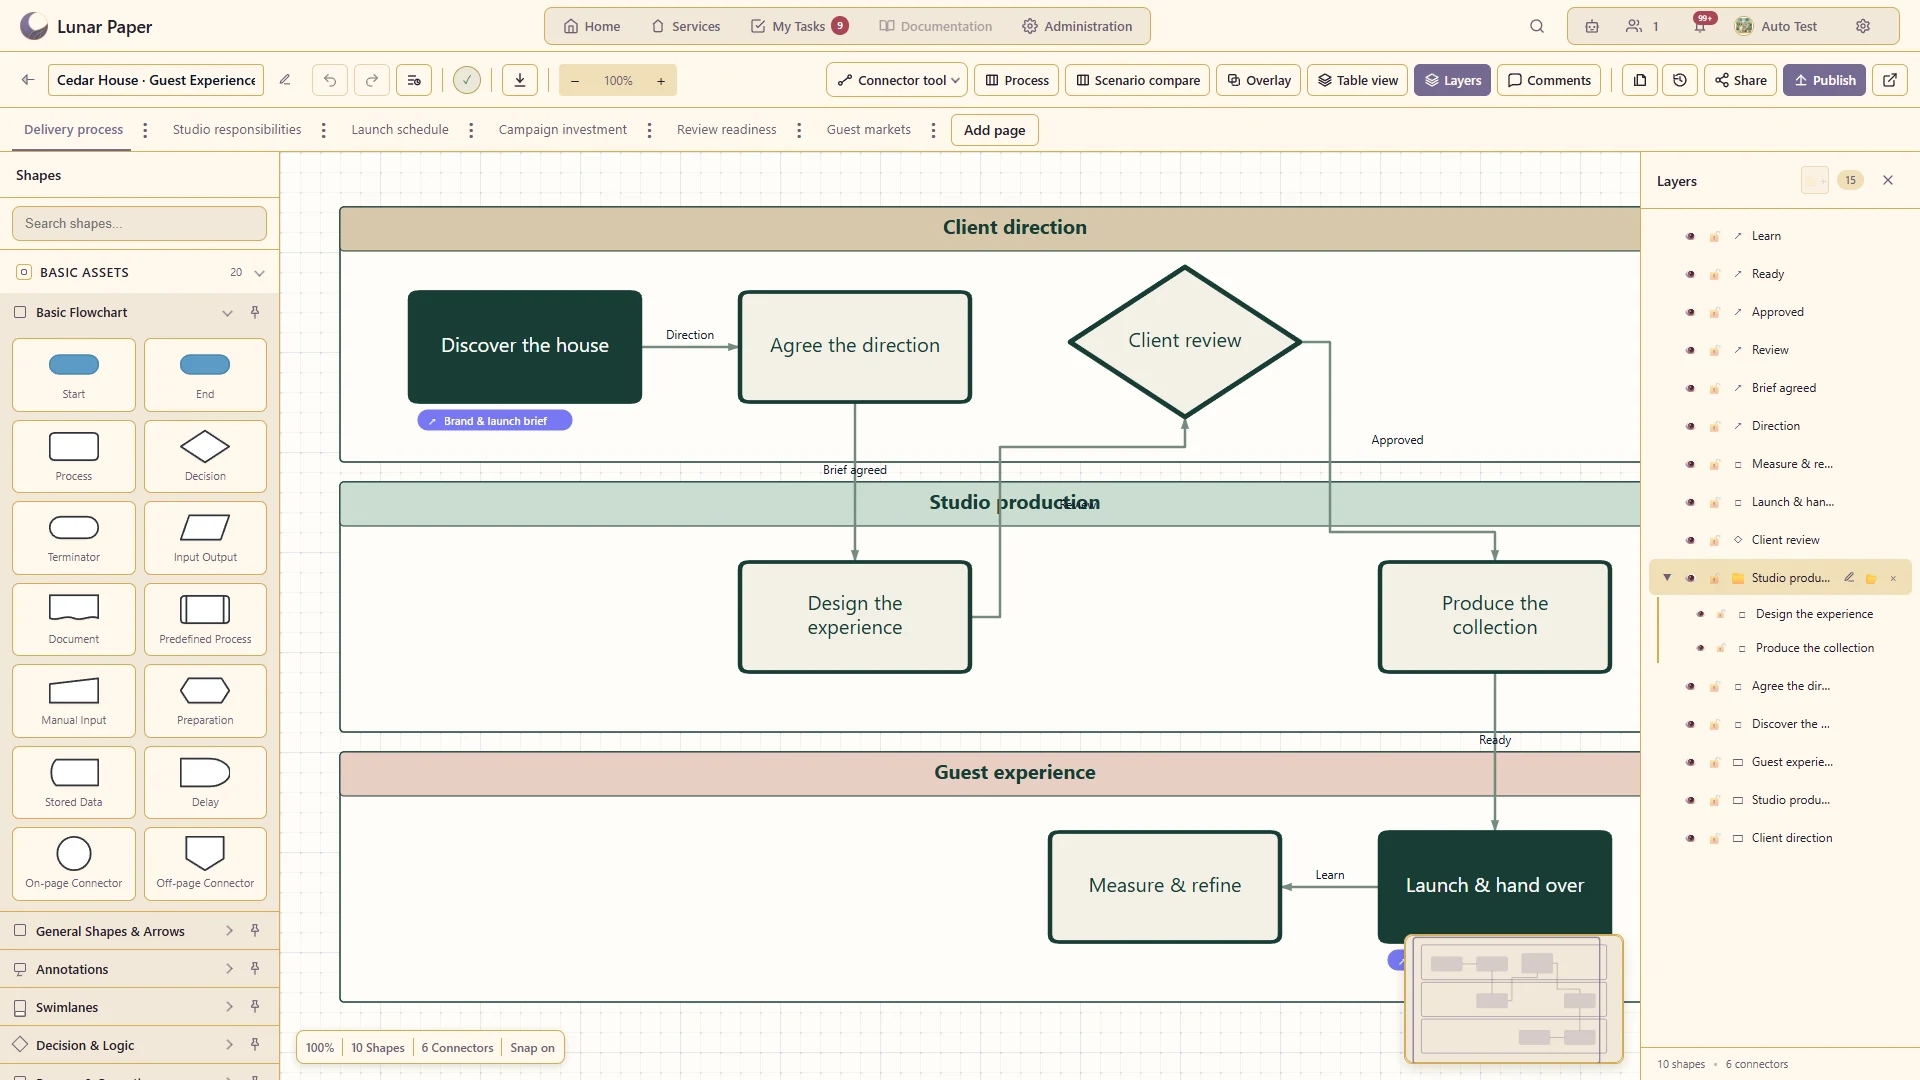
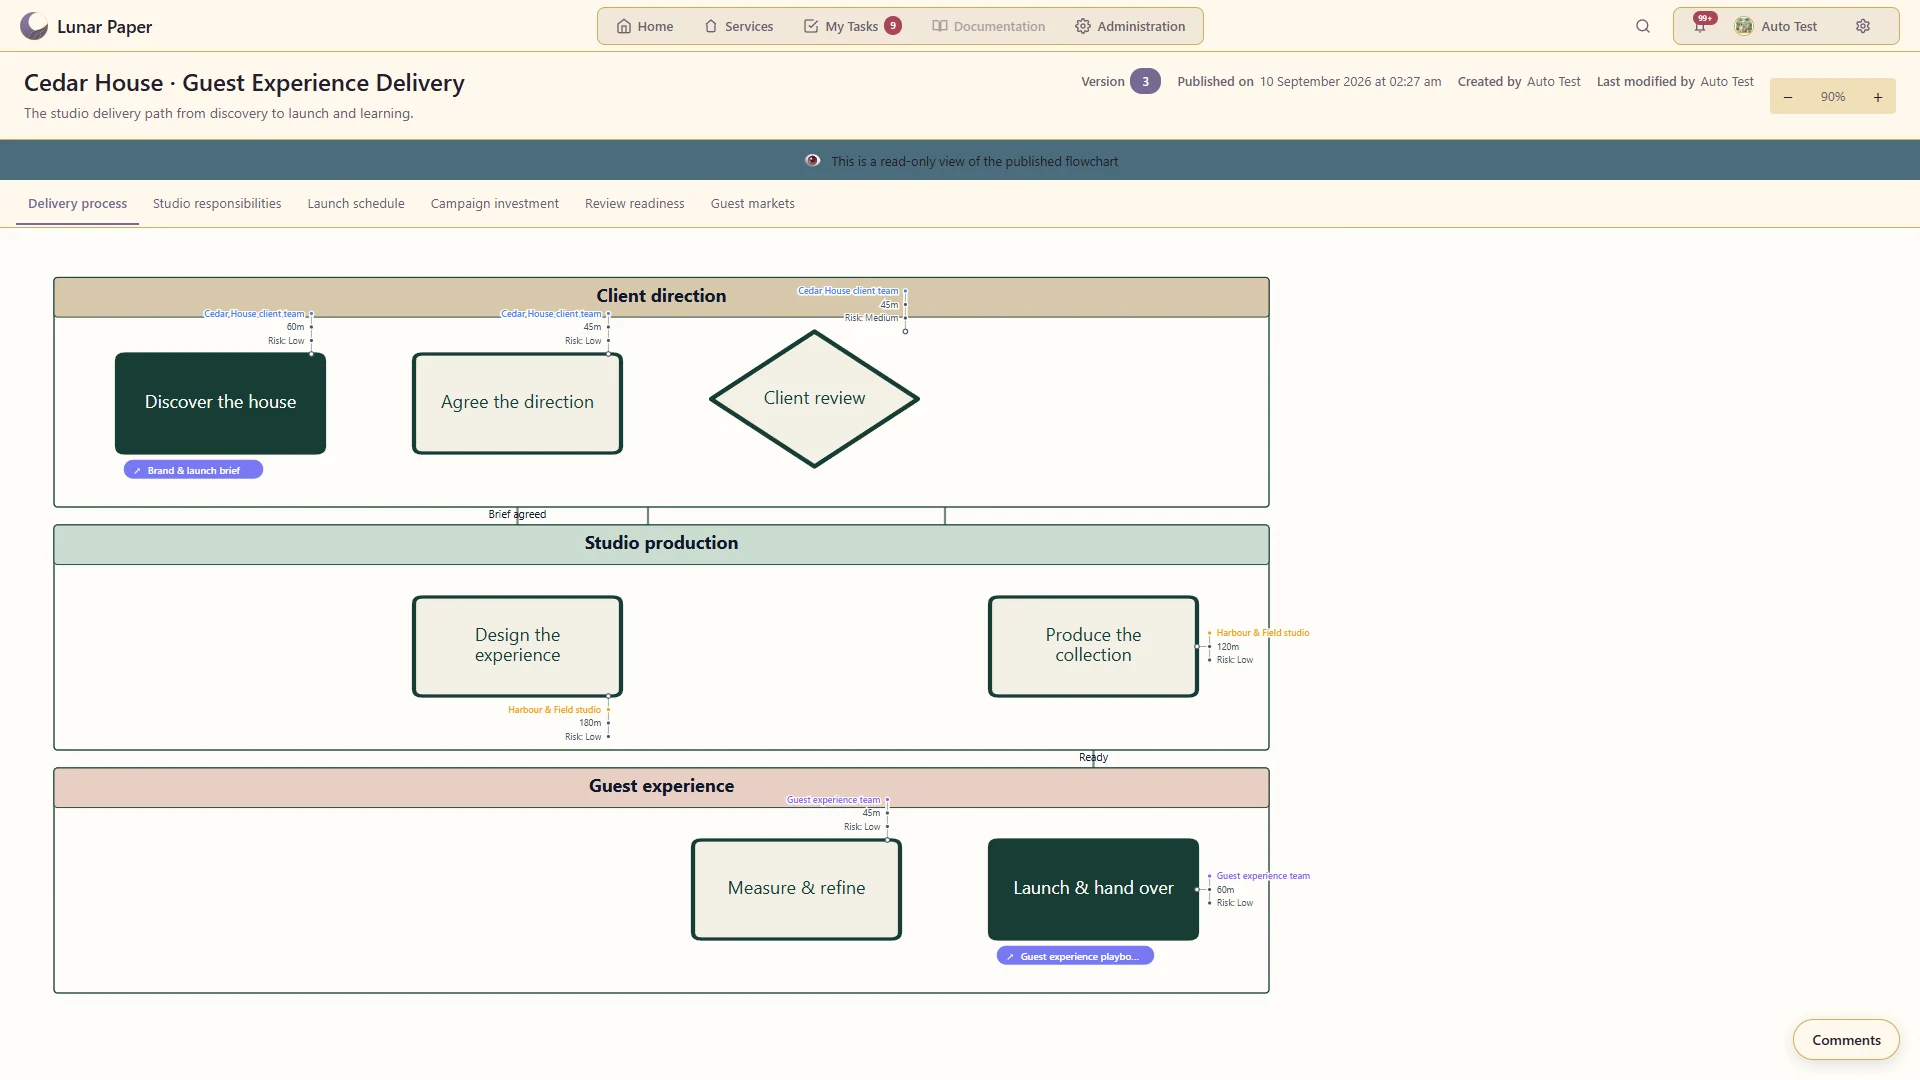
Explain how a process moves between departments, people and systems.
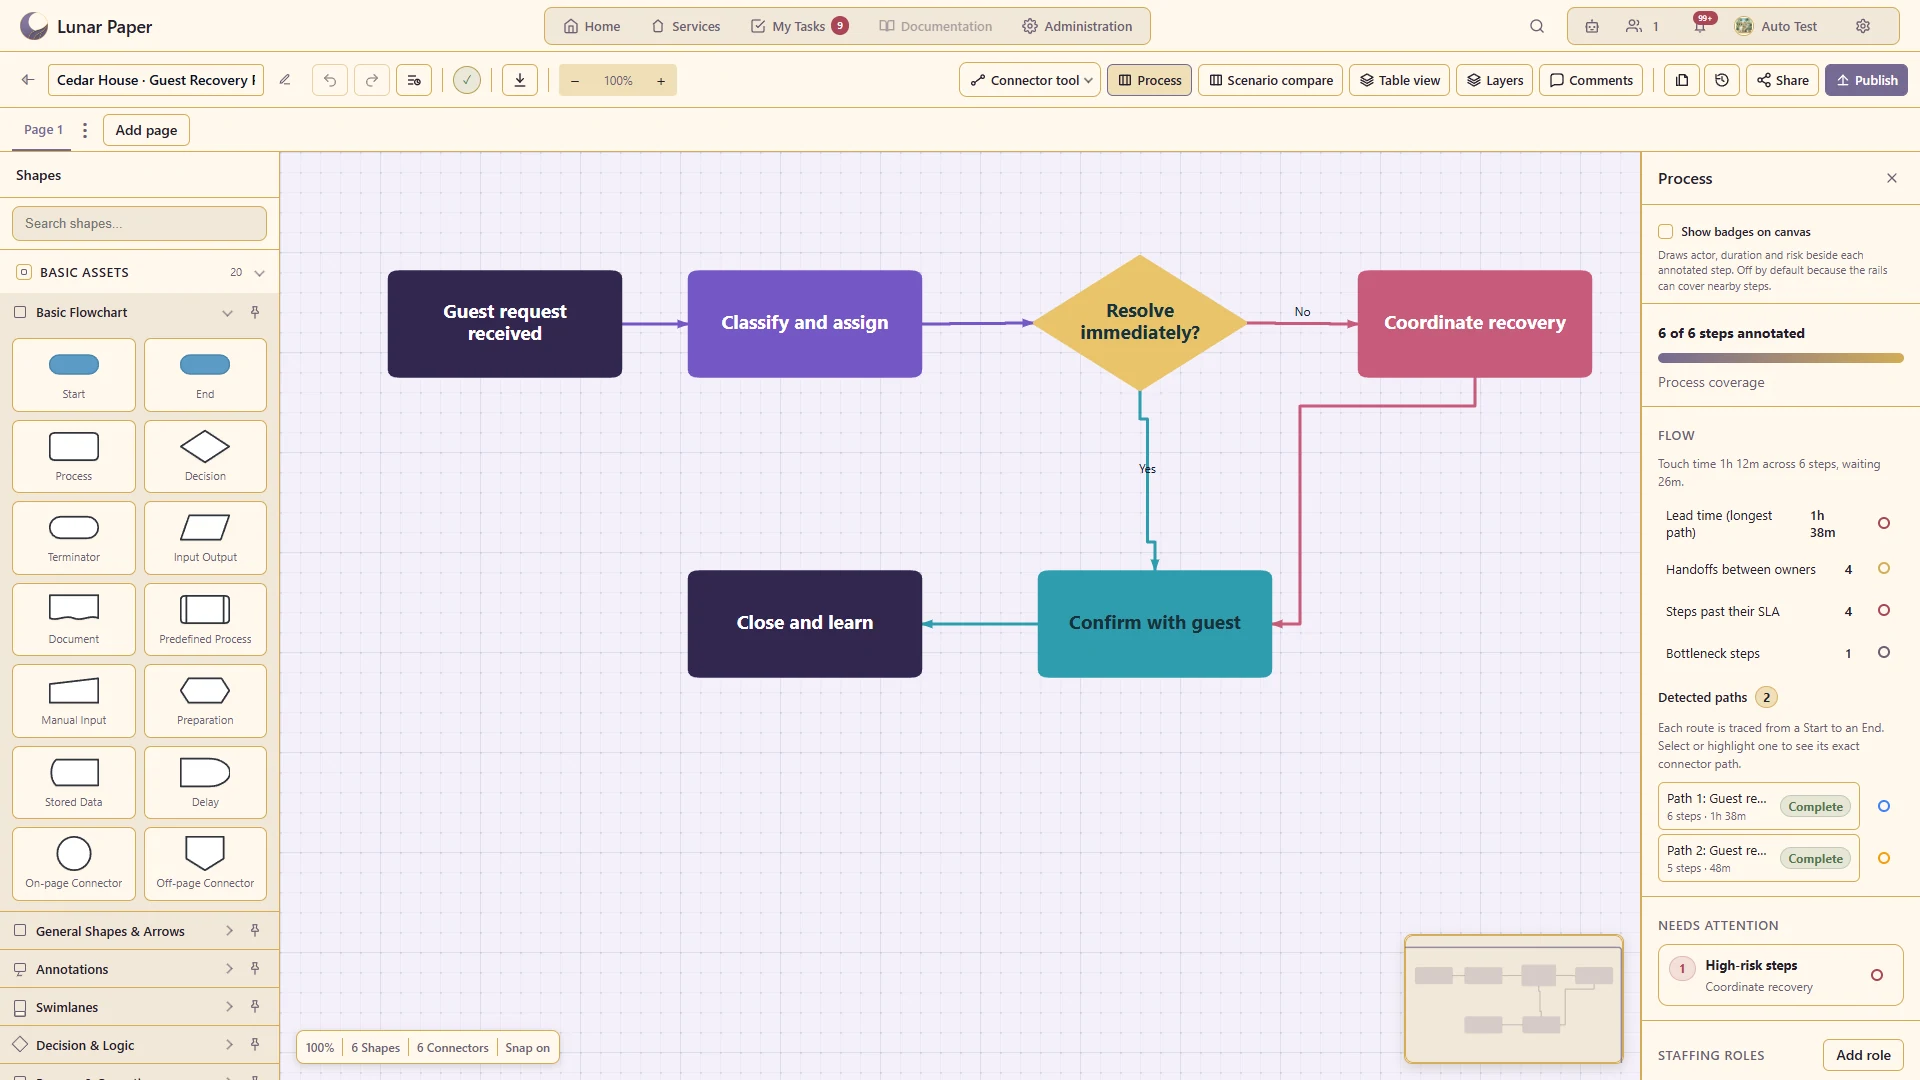
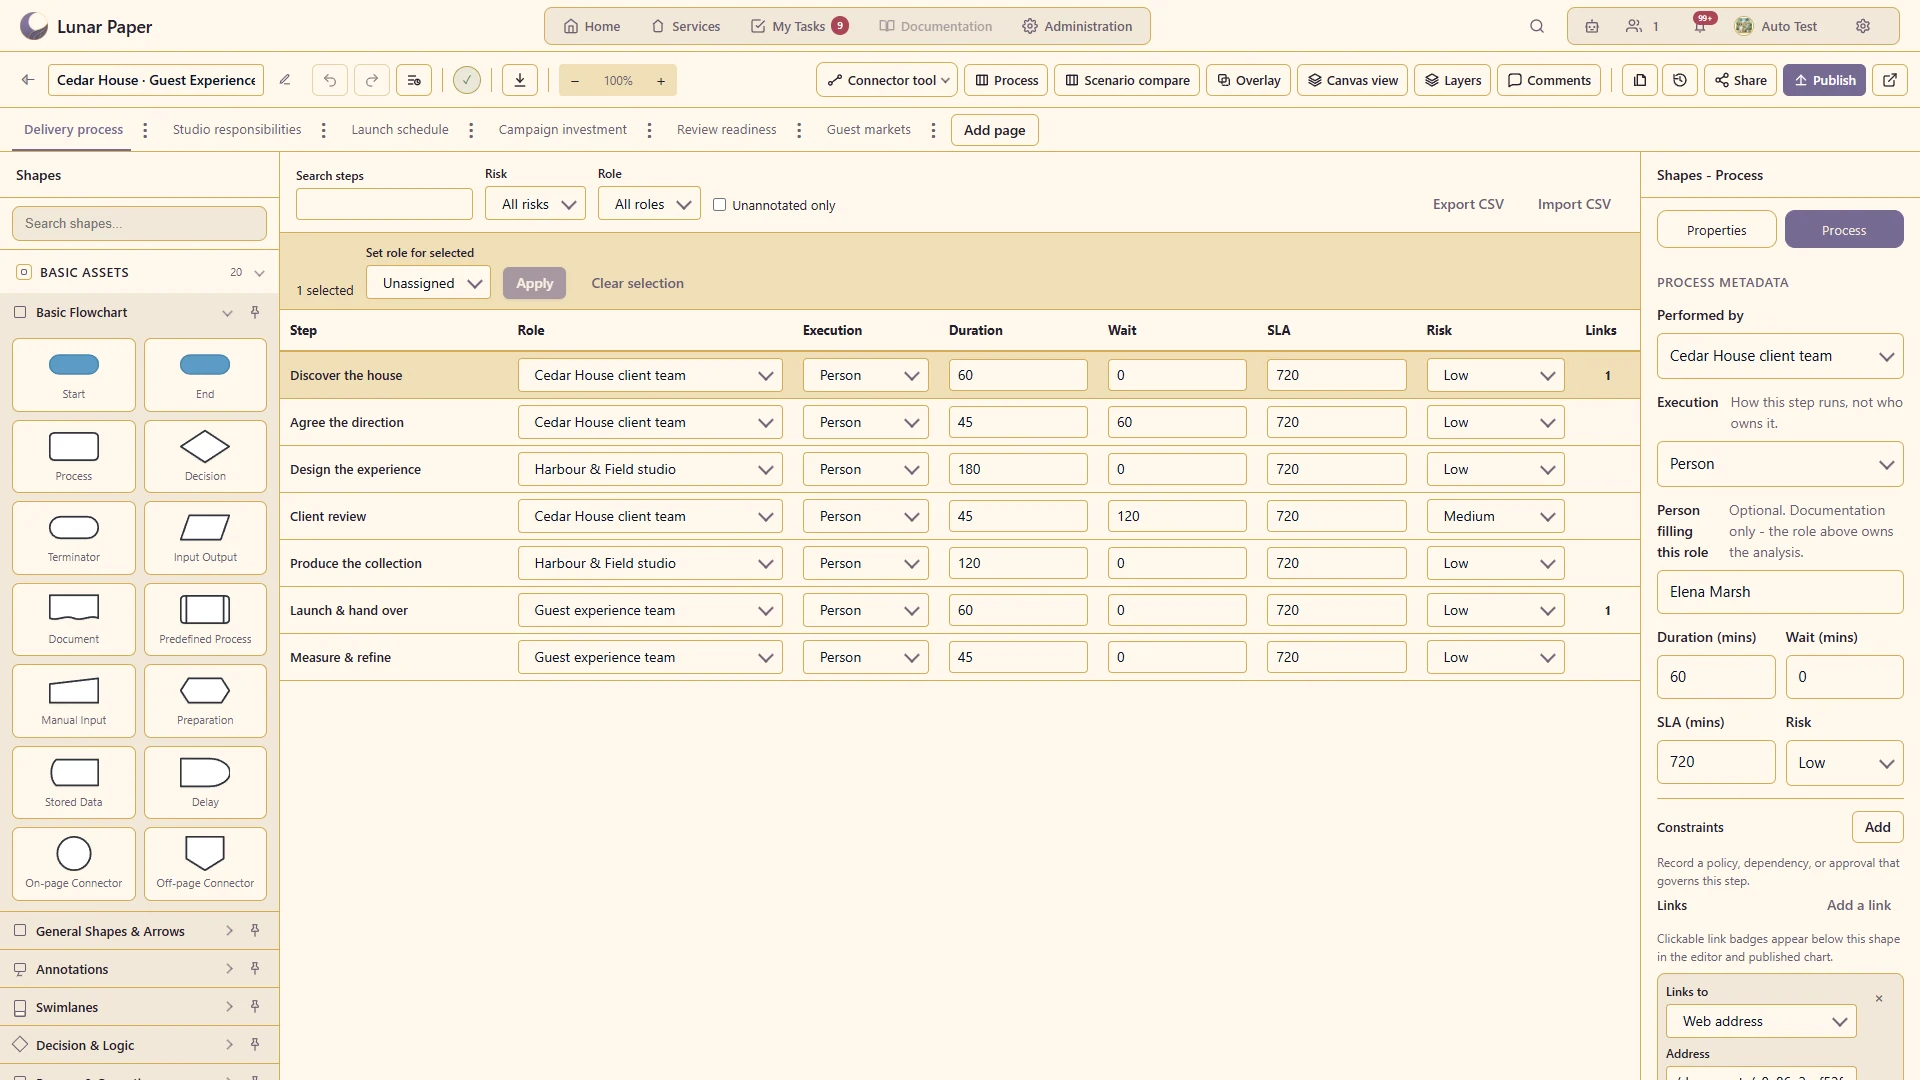
Add supported role, timing and other process information to the visual steps.
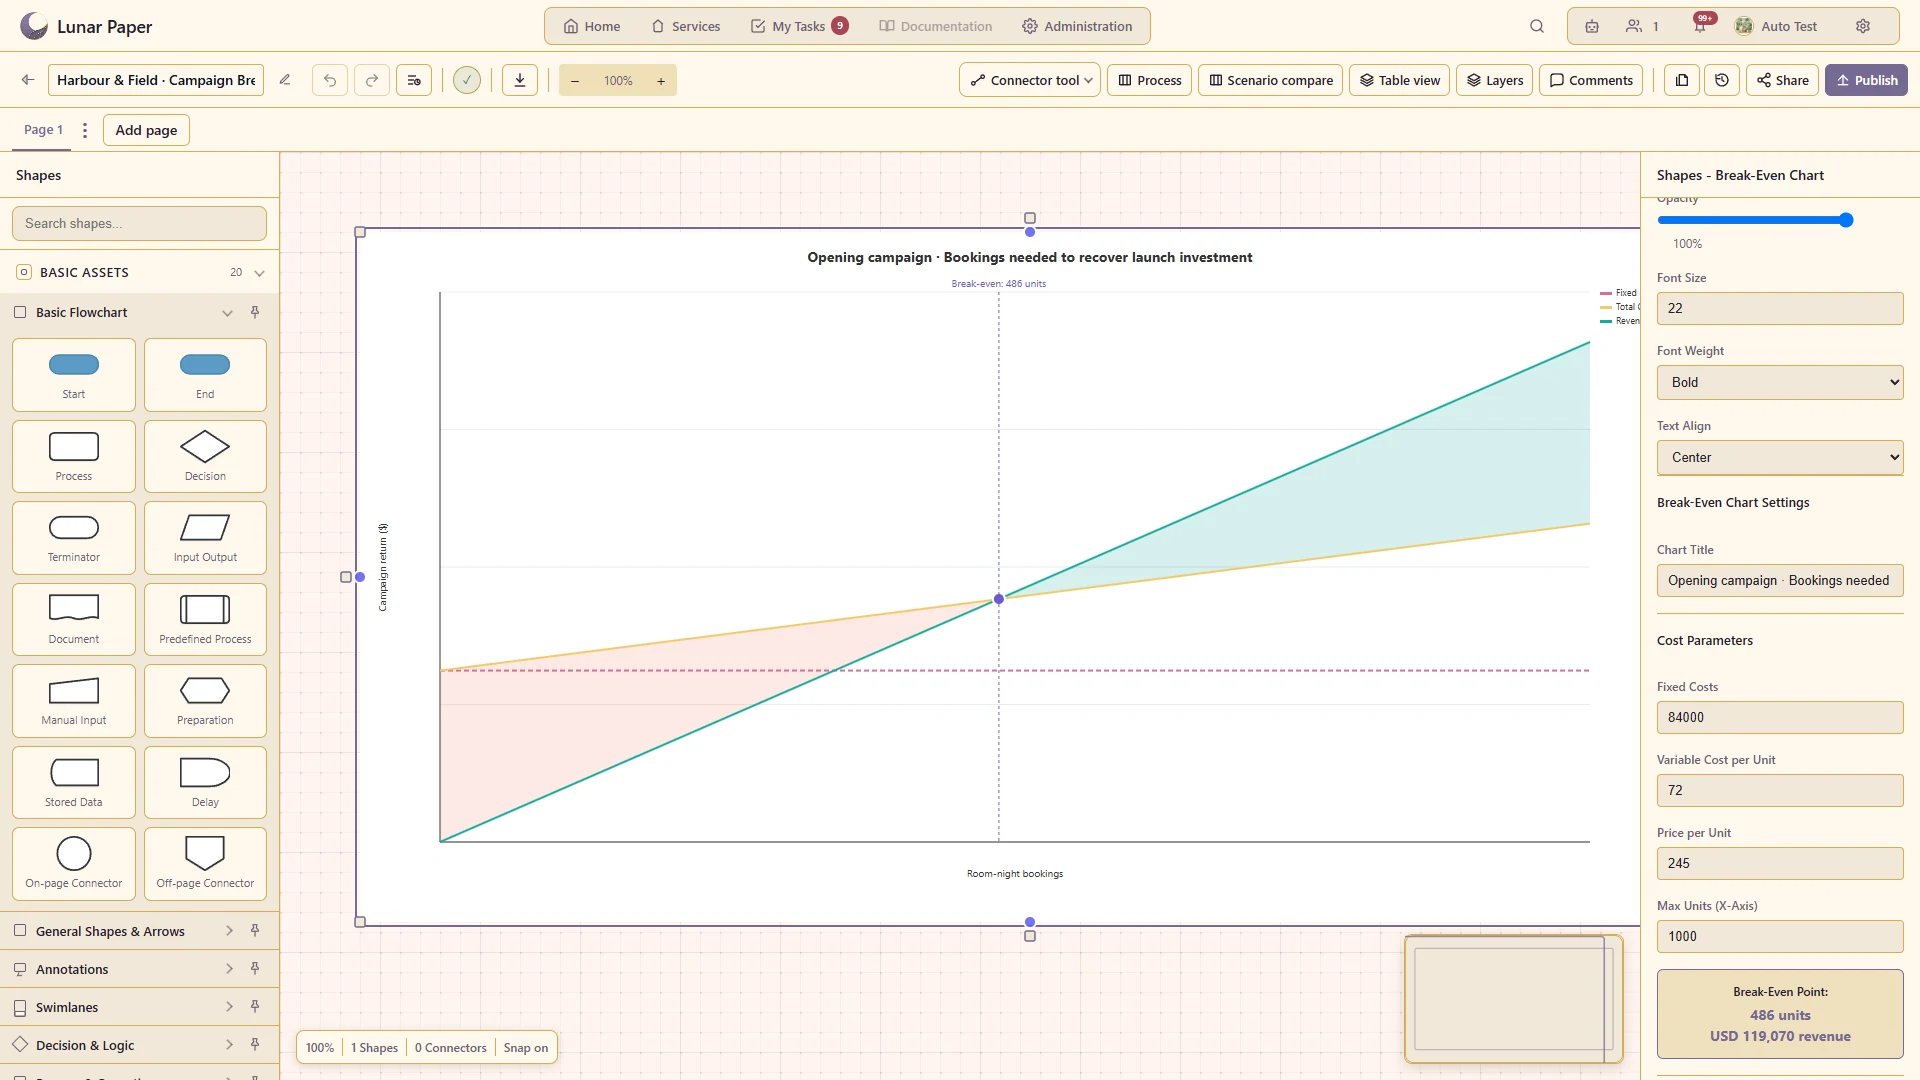
Put populated charts inside a diagram rather than showing only boxes and arrows.
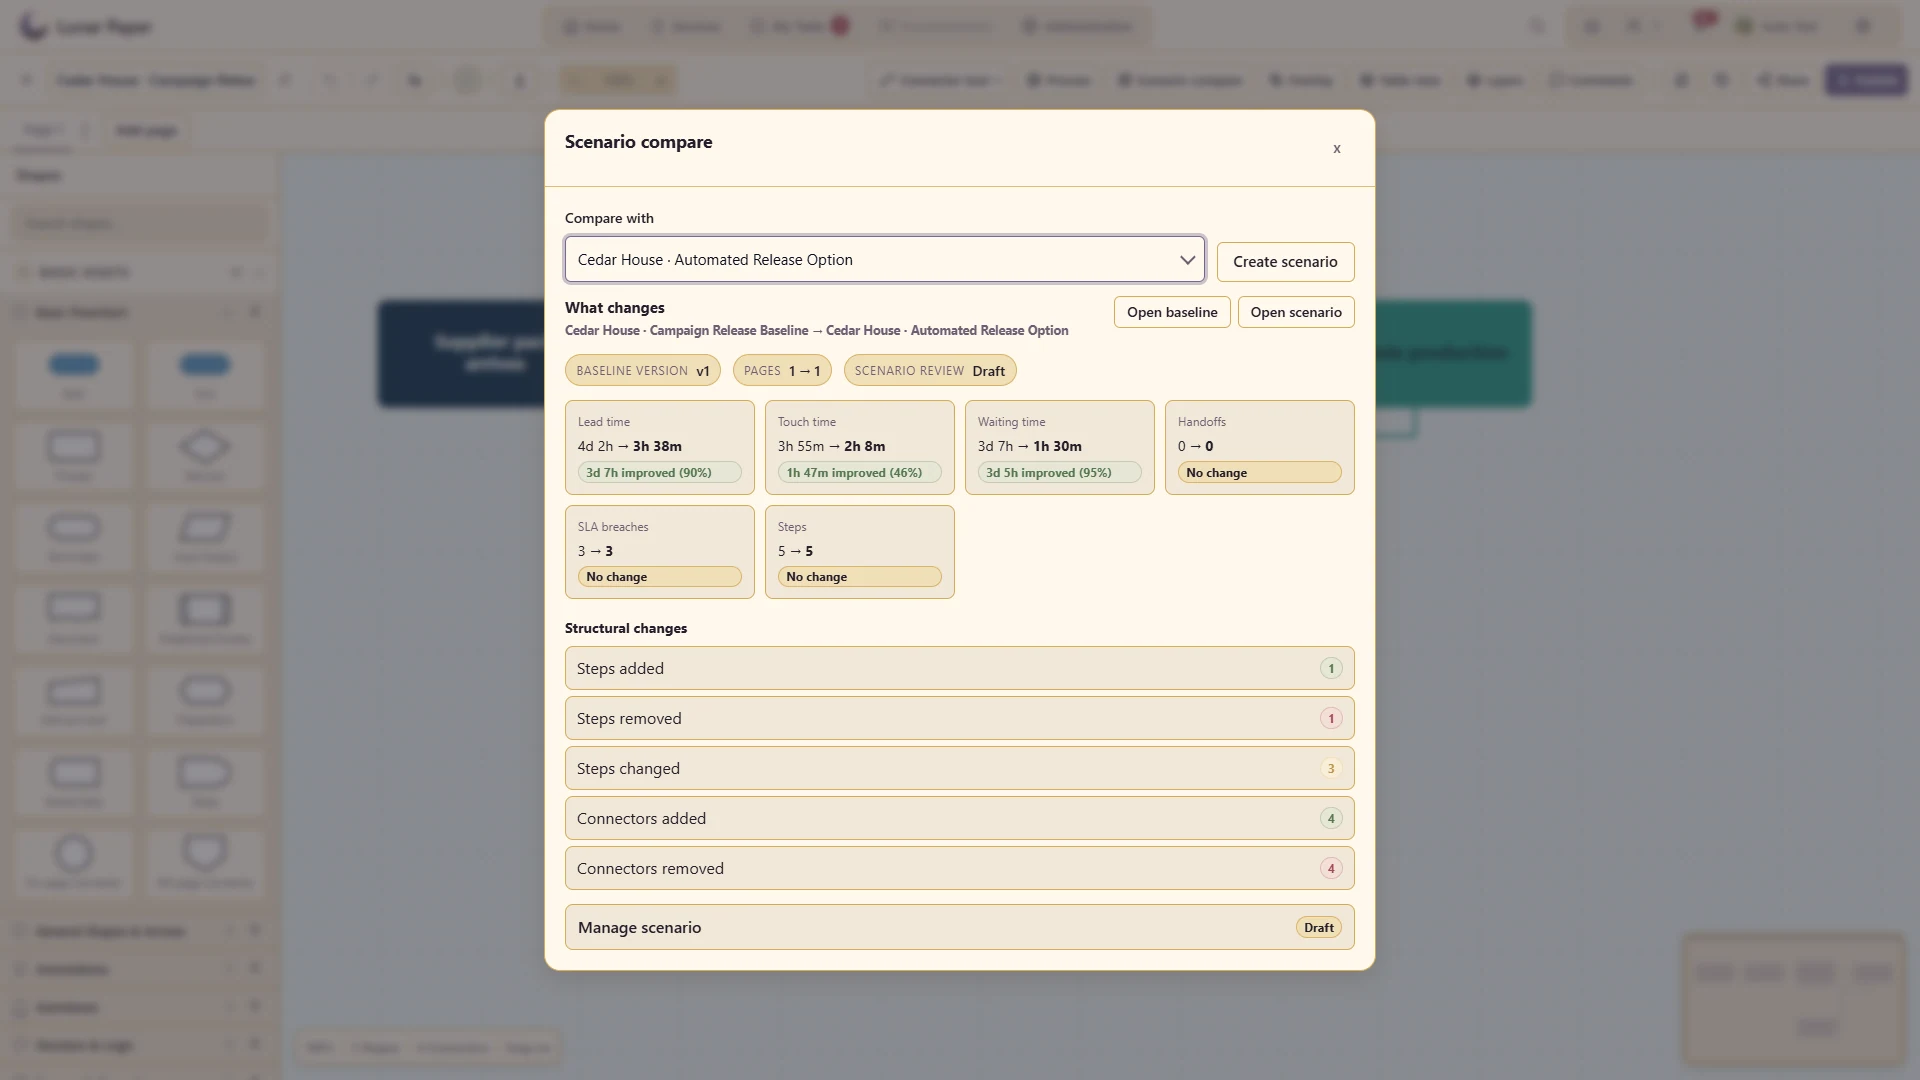
Compare a baseline process with an alternative and inspect structural or metric differences.
Connect a visual step to relevant application content or an allowed destination.
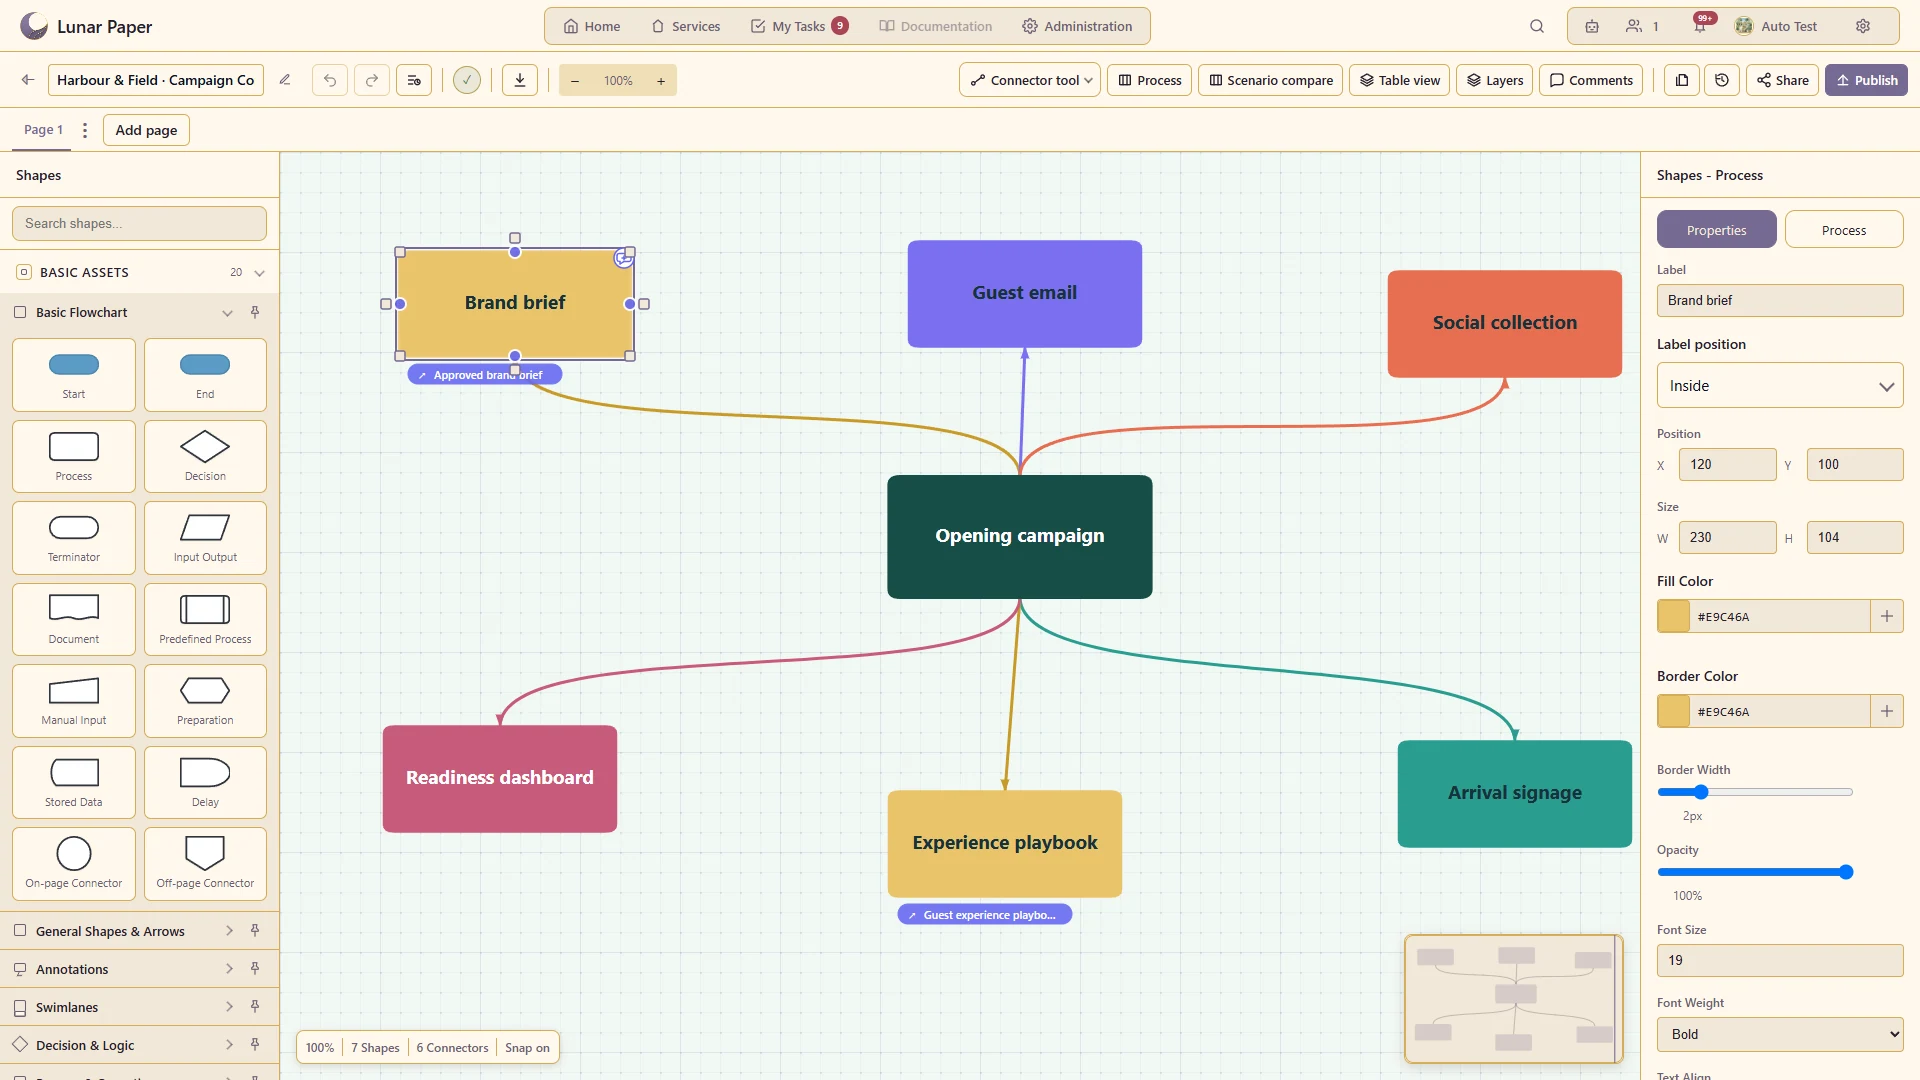
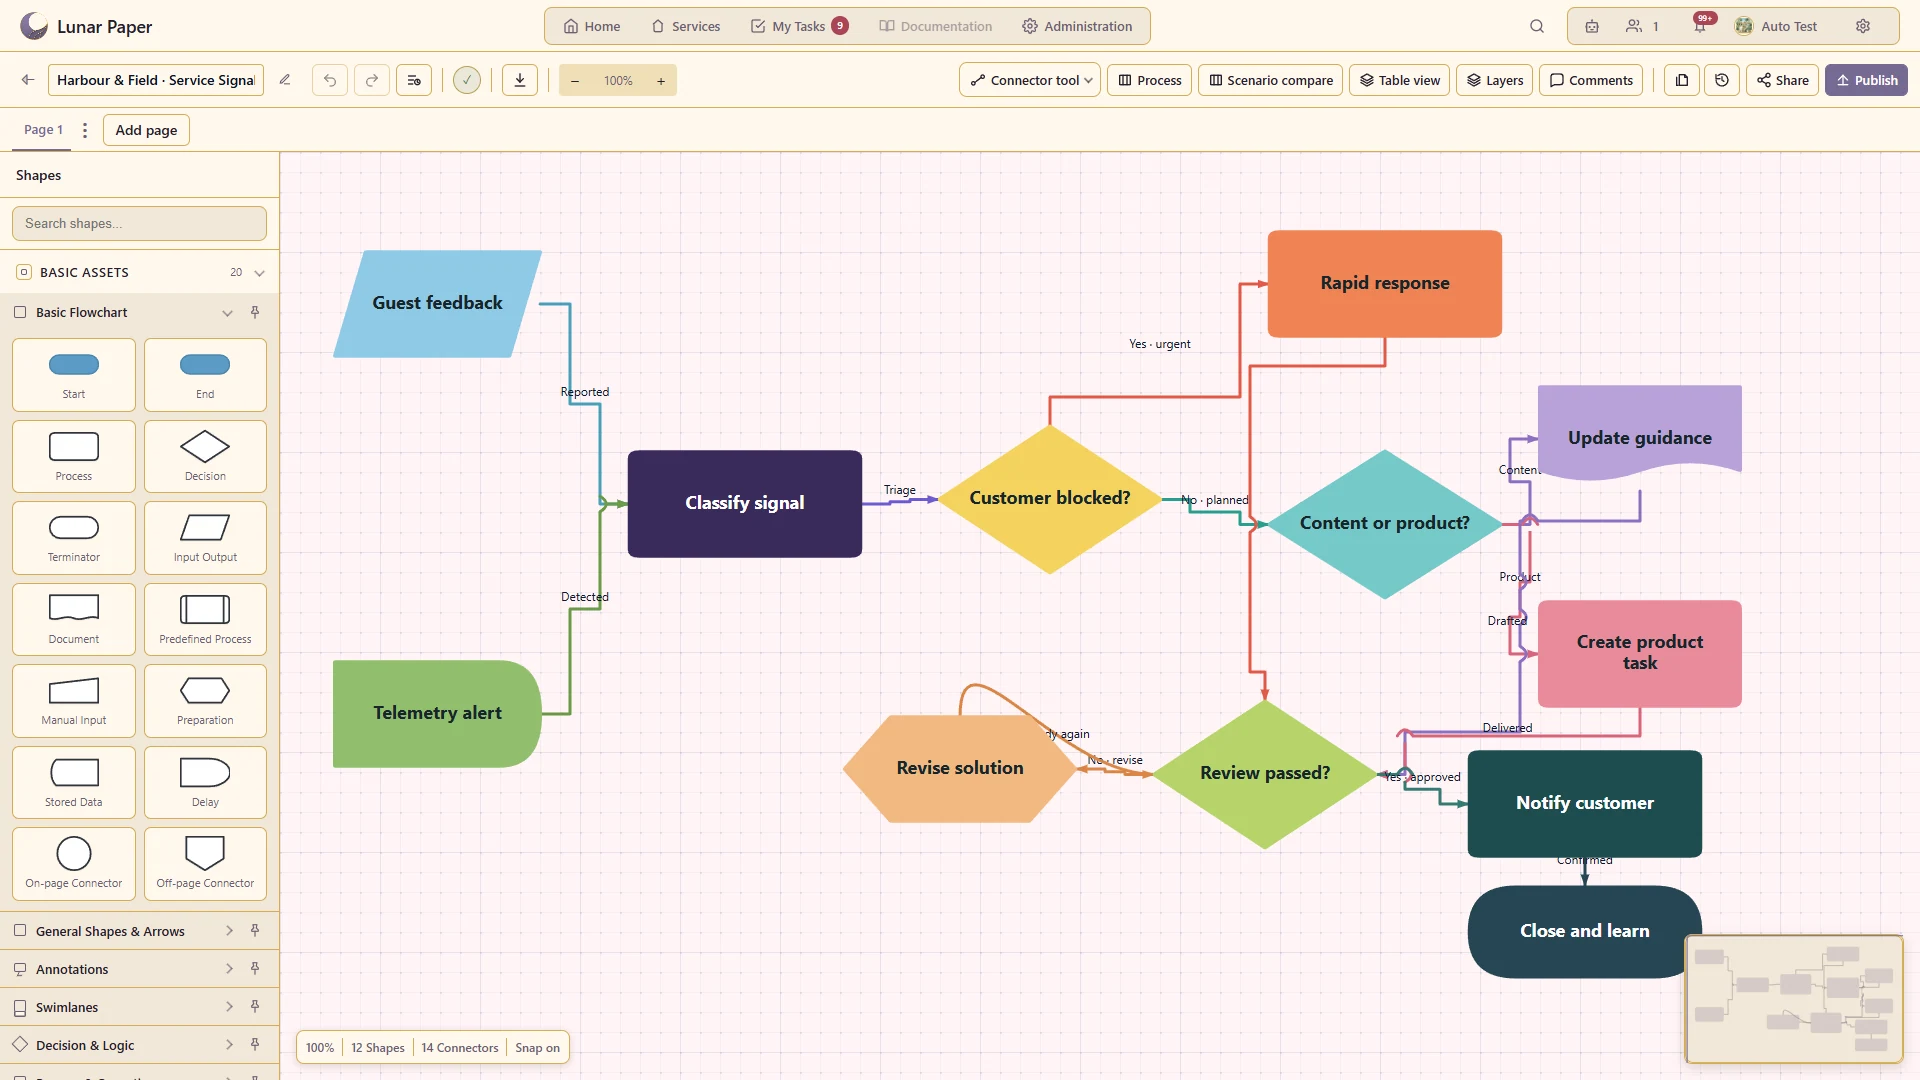
Build a readable process with labelled nodes, decisions and connectors.
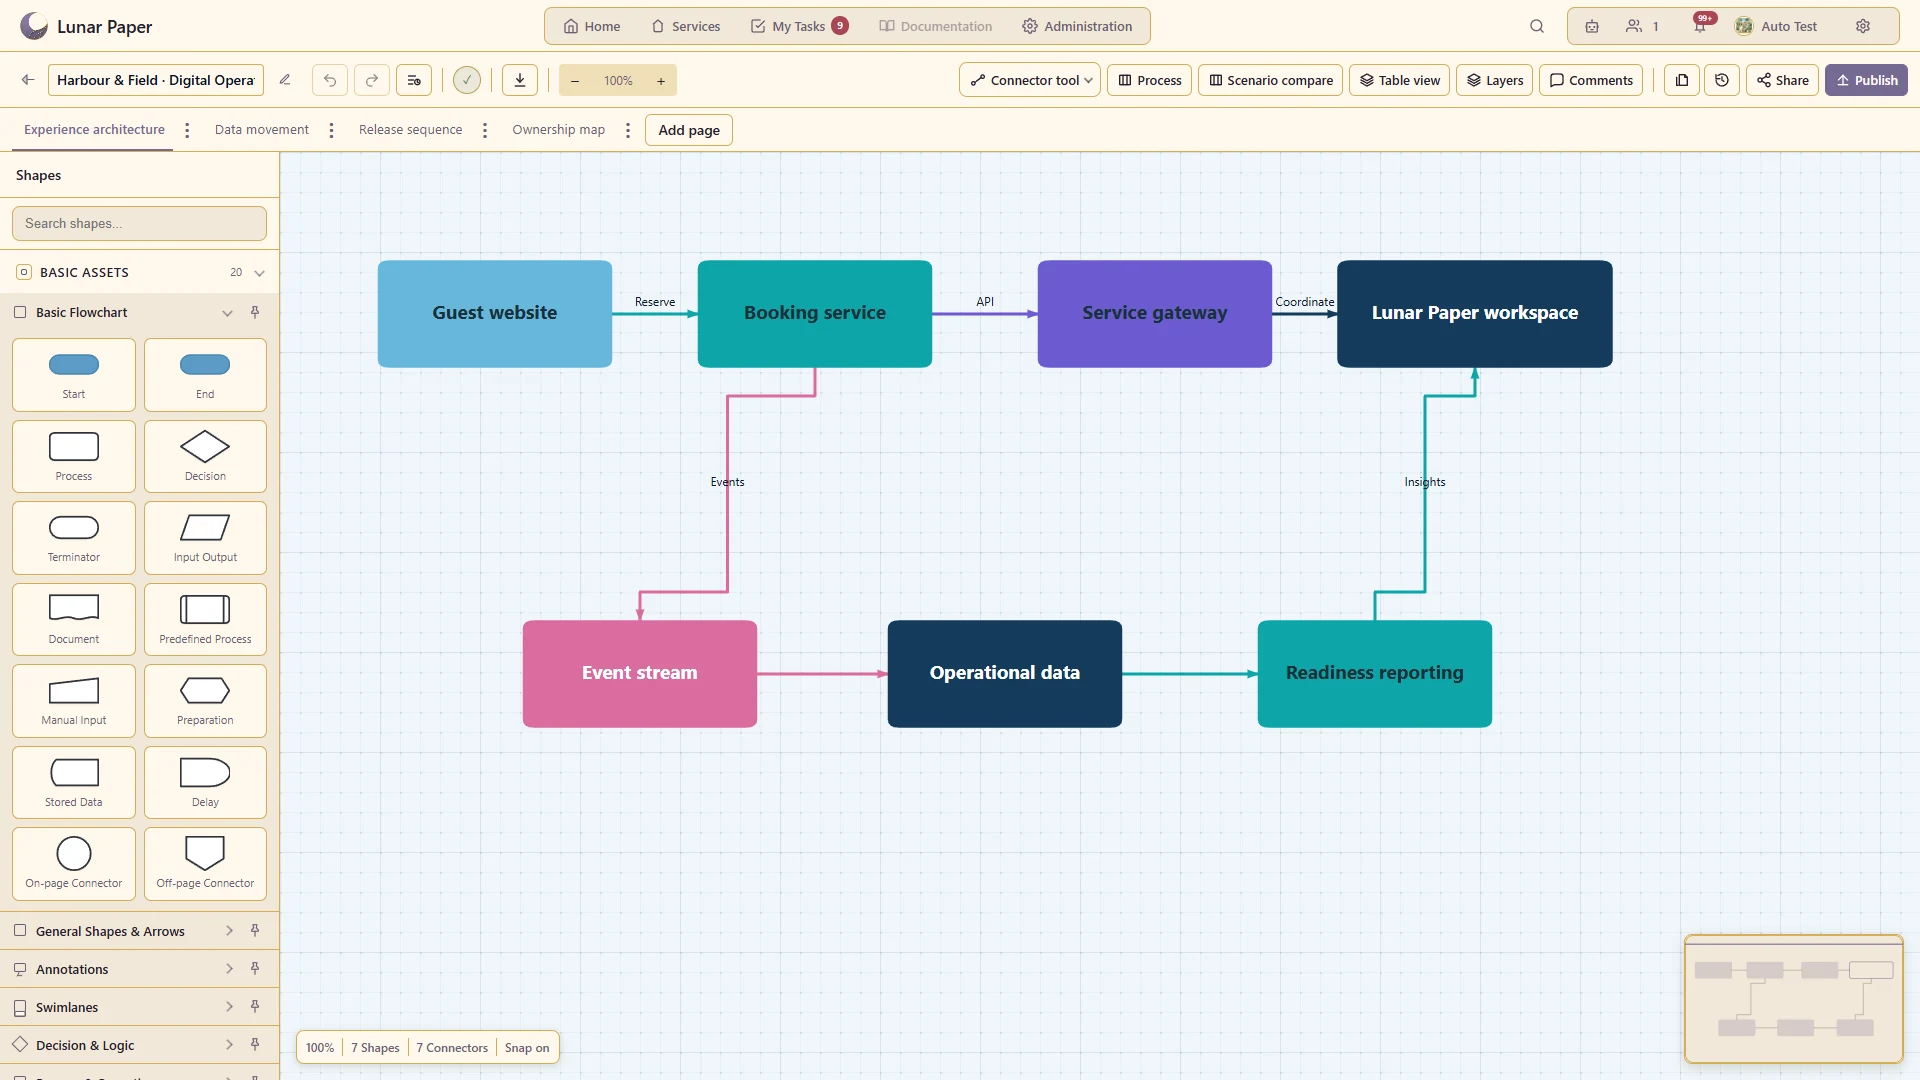
Divide a substantial chart document into independently editable pages.
Use specialised shape libraries for different kinds of diagram.
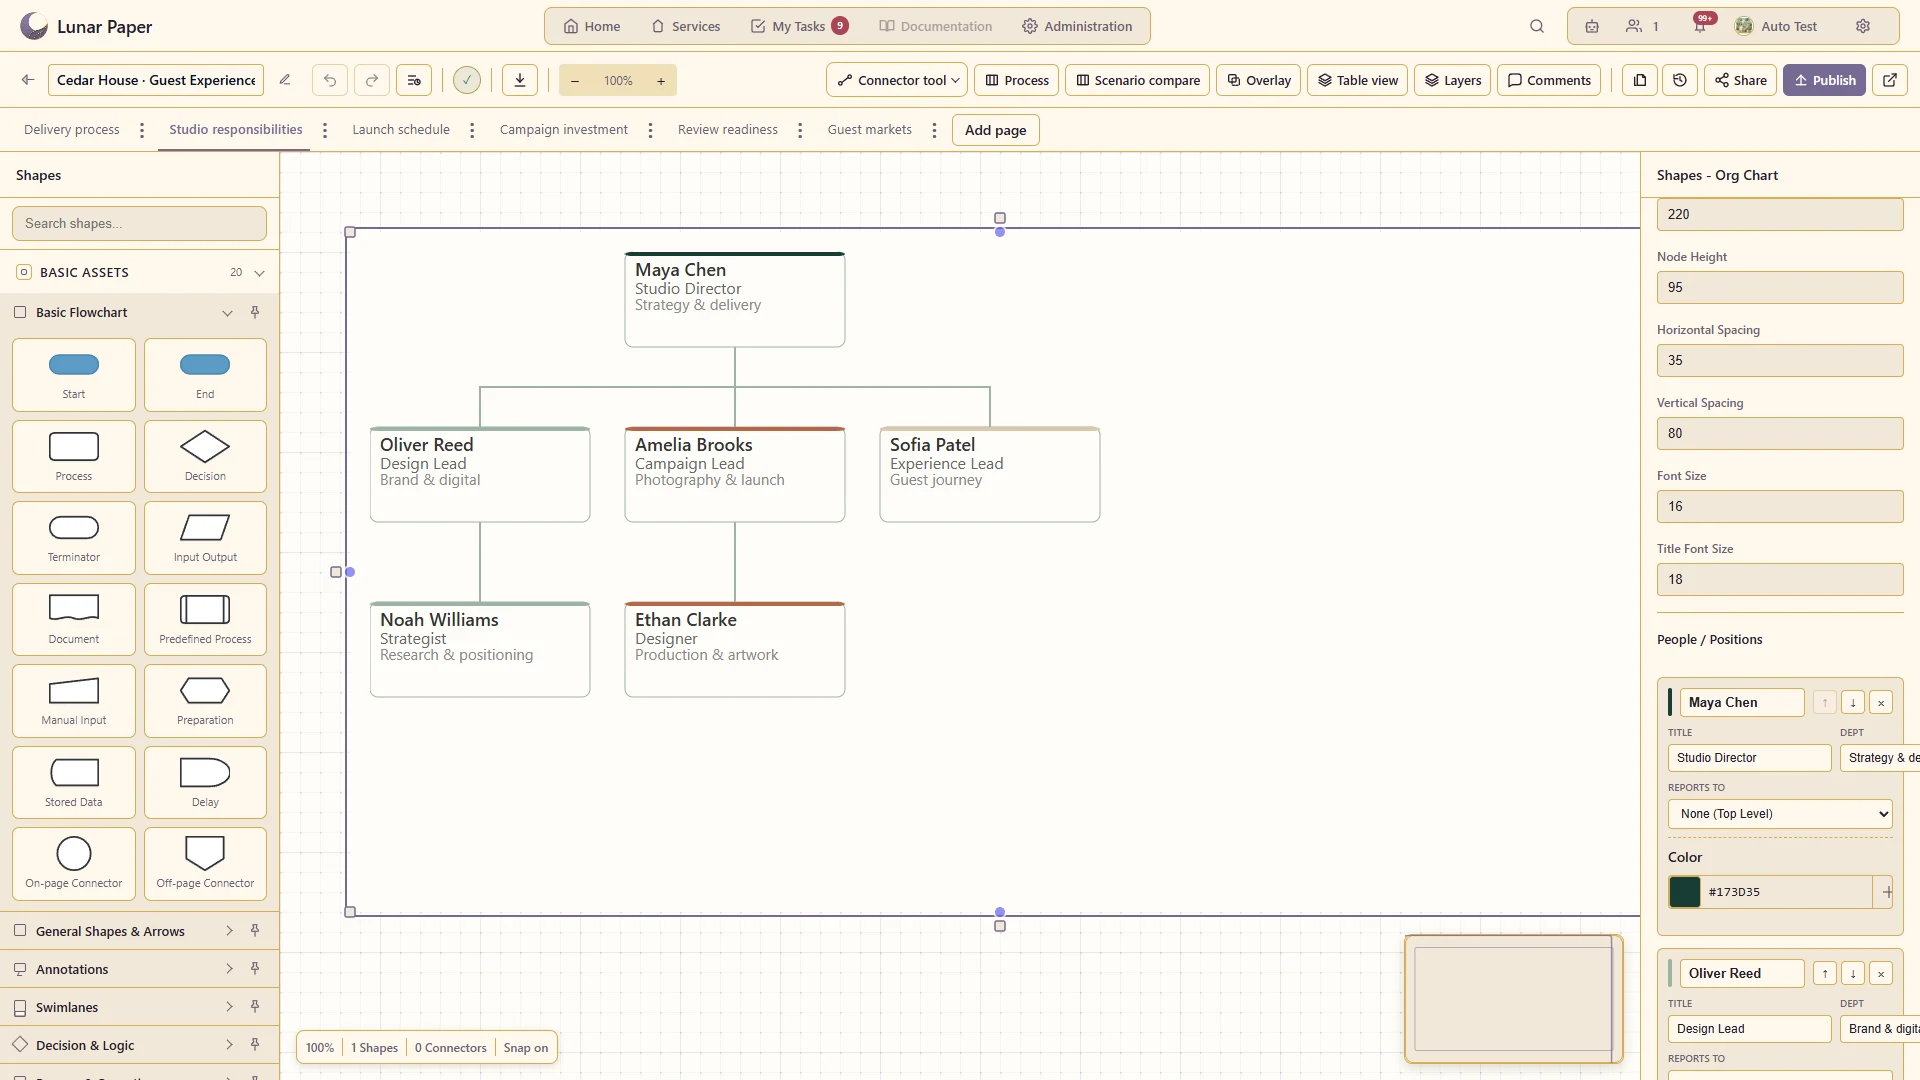
Show people or functions as a hierarchy.
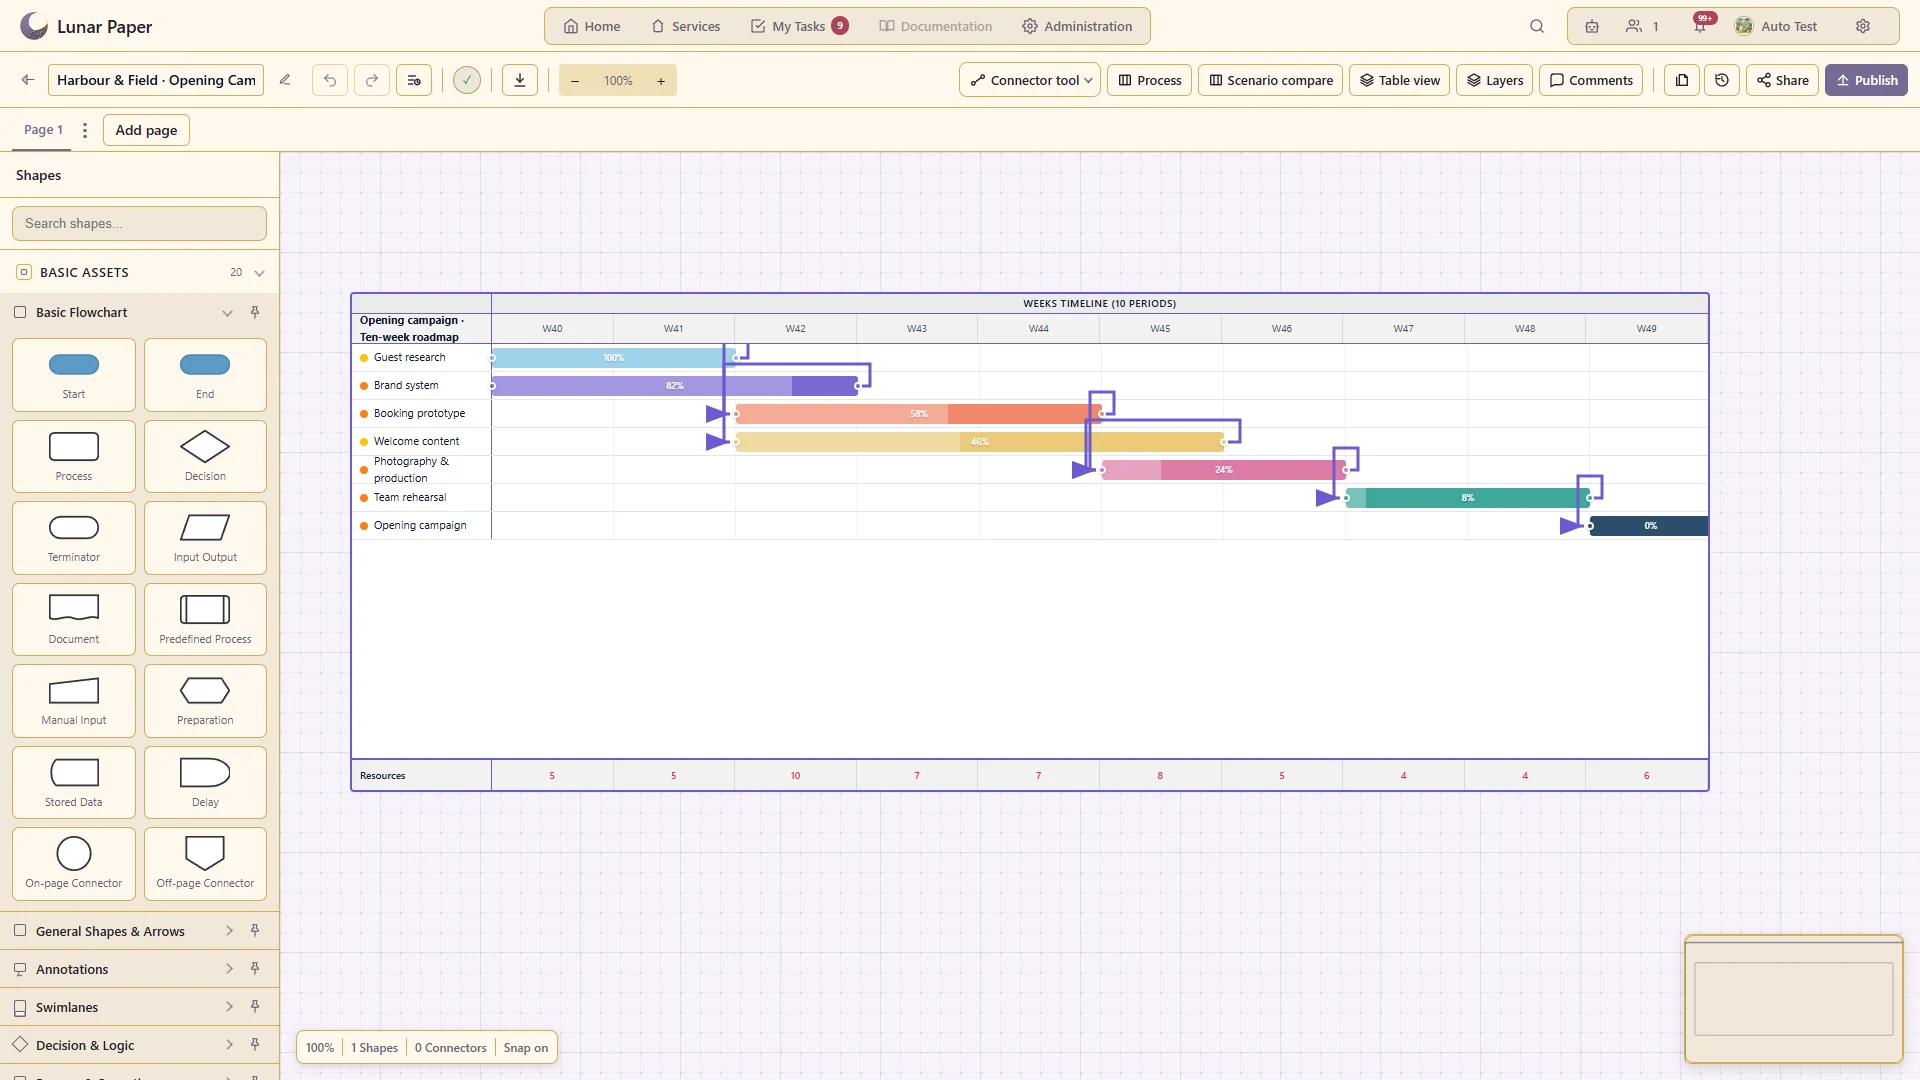
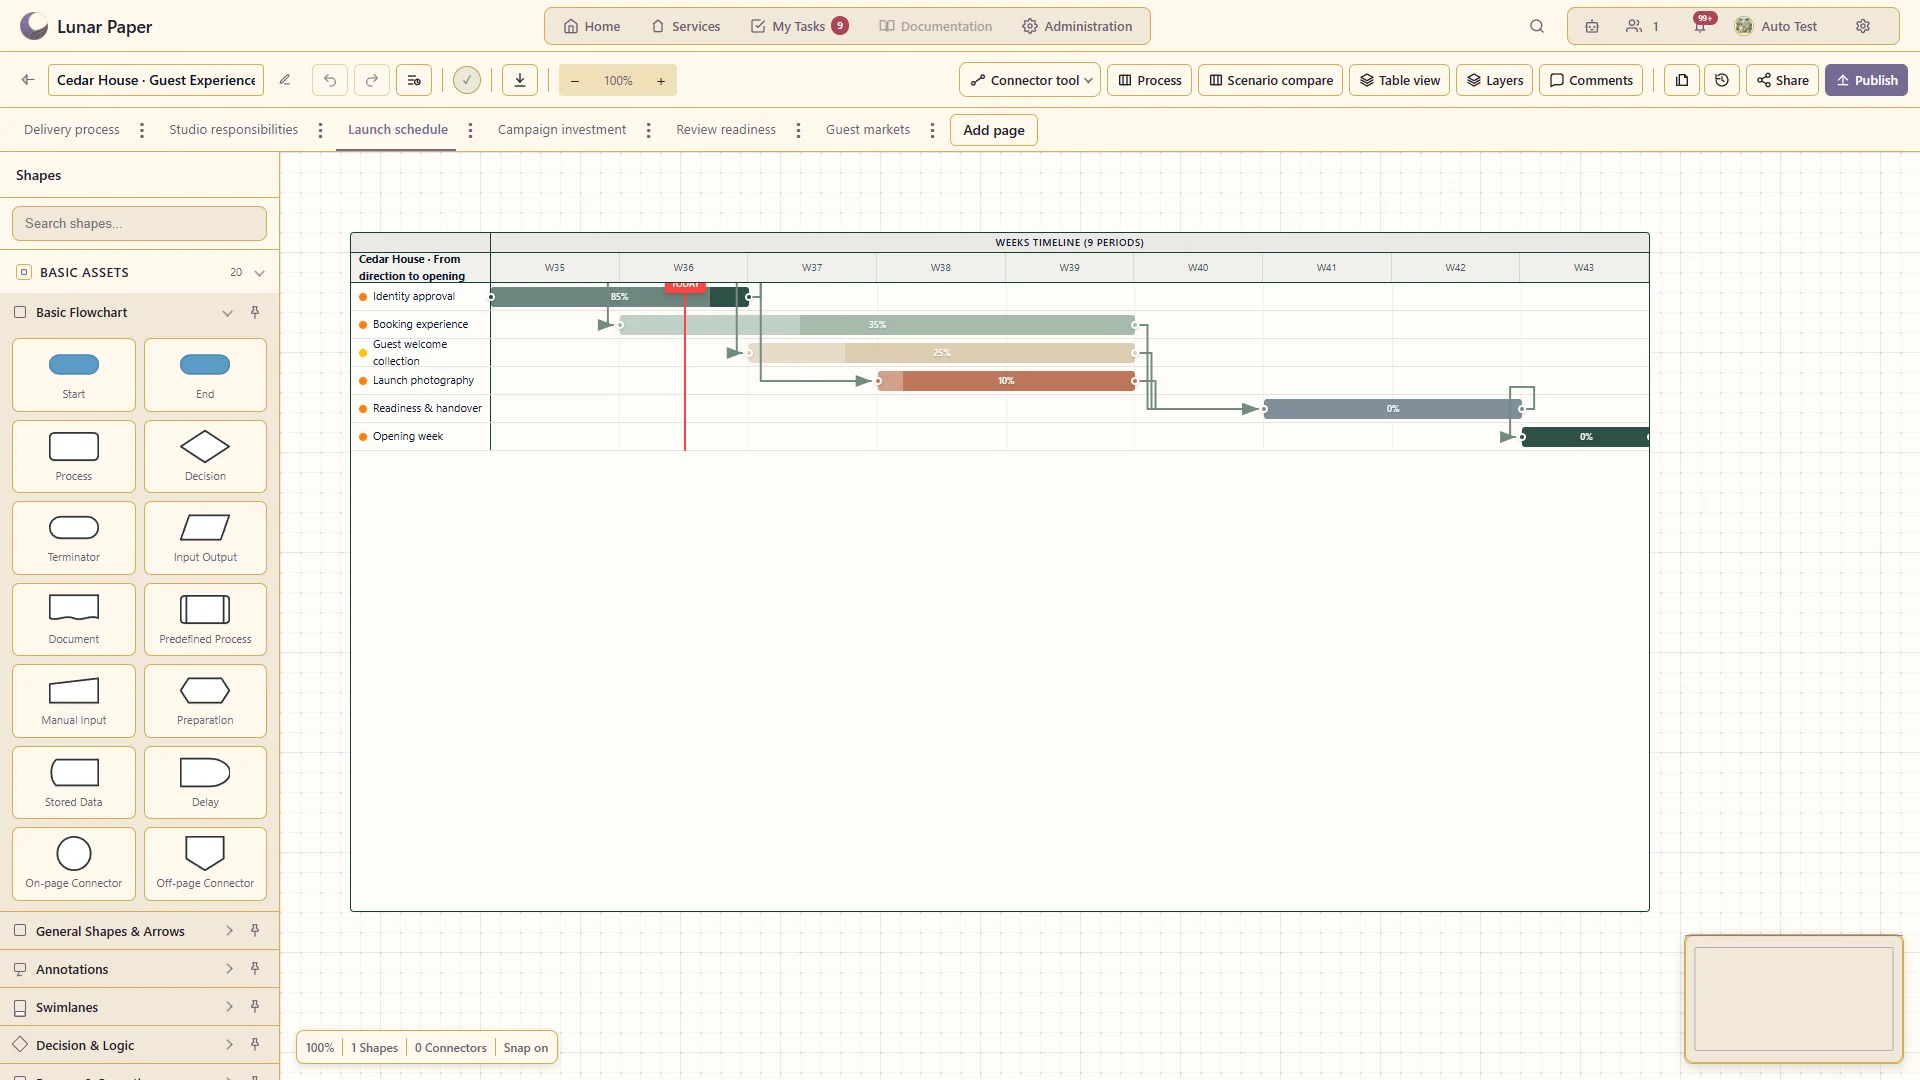
Explain schedules and delivery dependencies with the dedicated chart types.
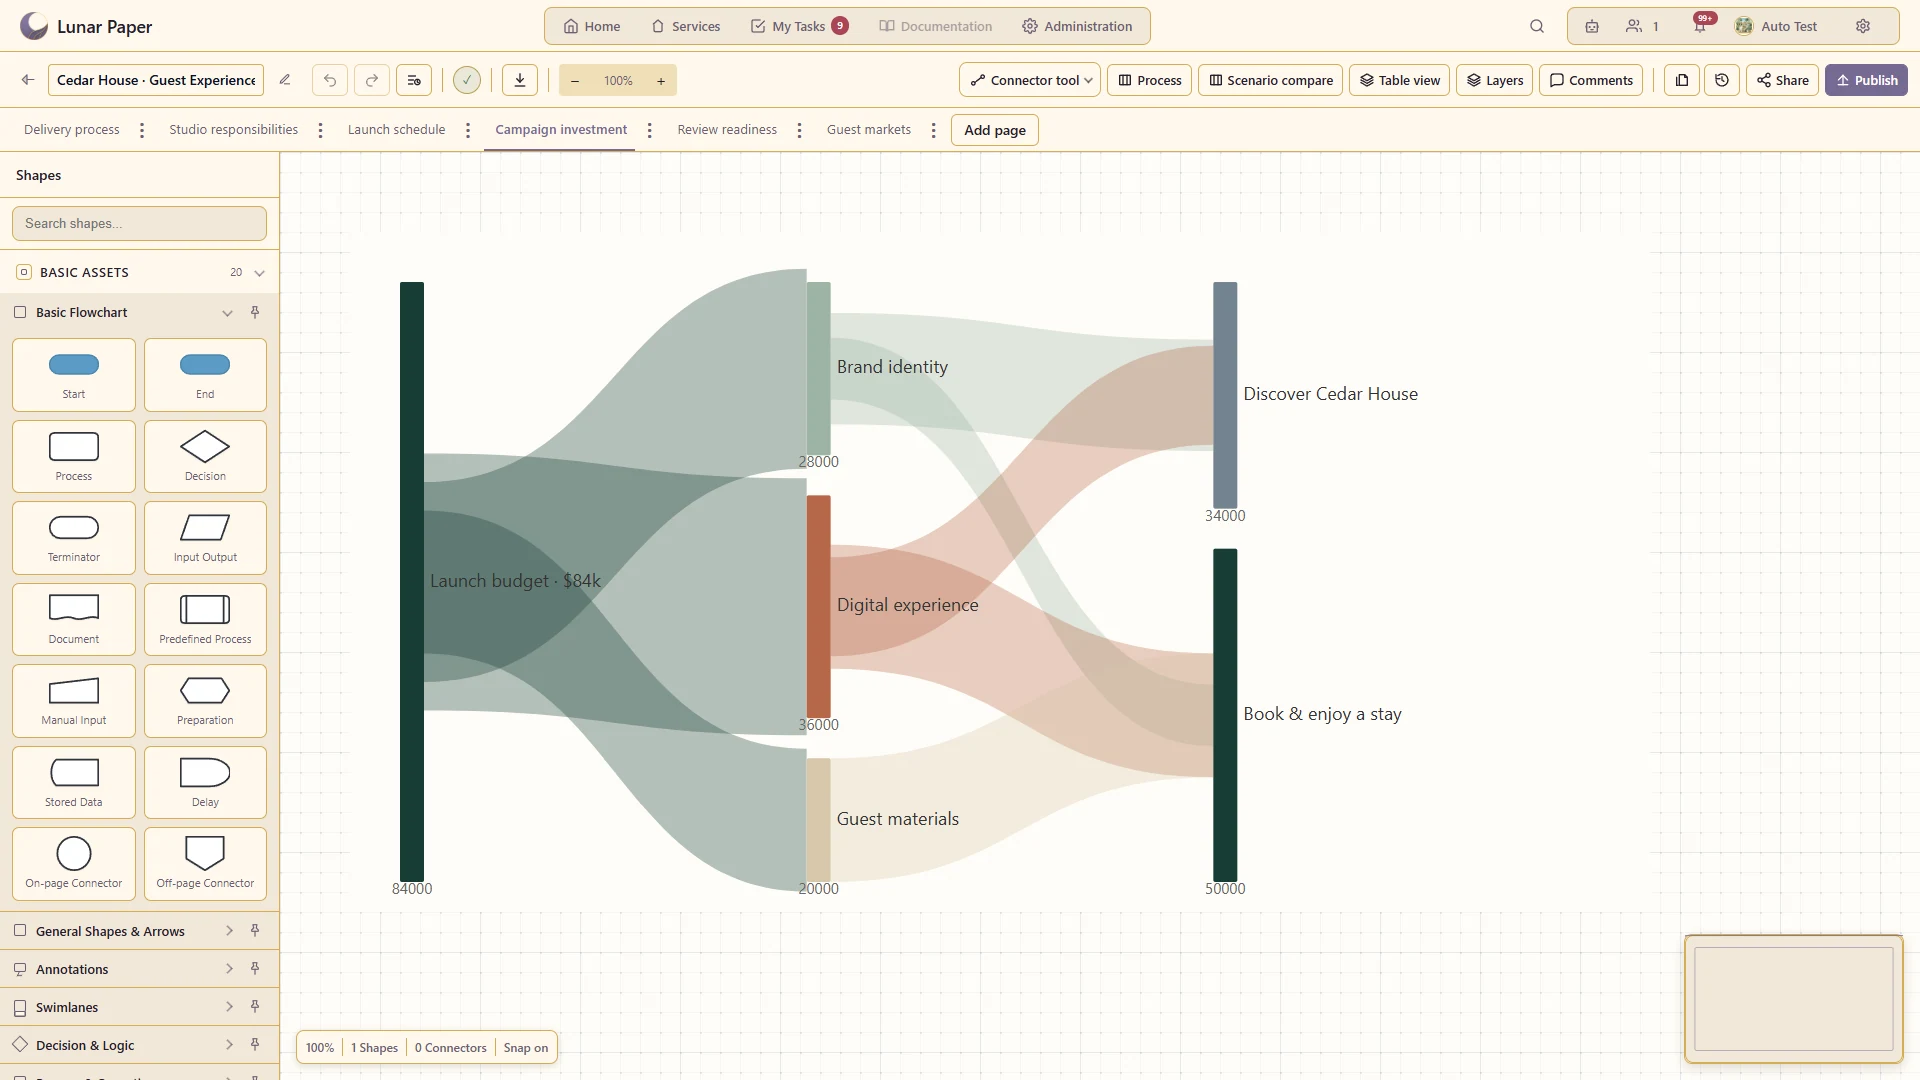
Show how quantities flow between stages or categories.
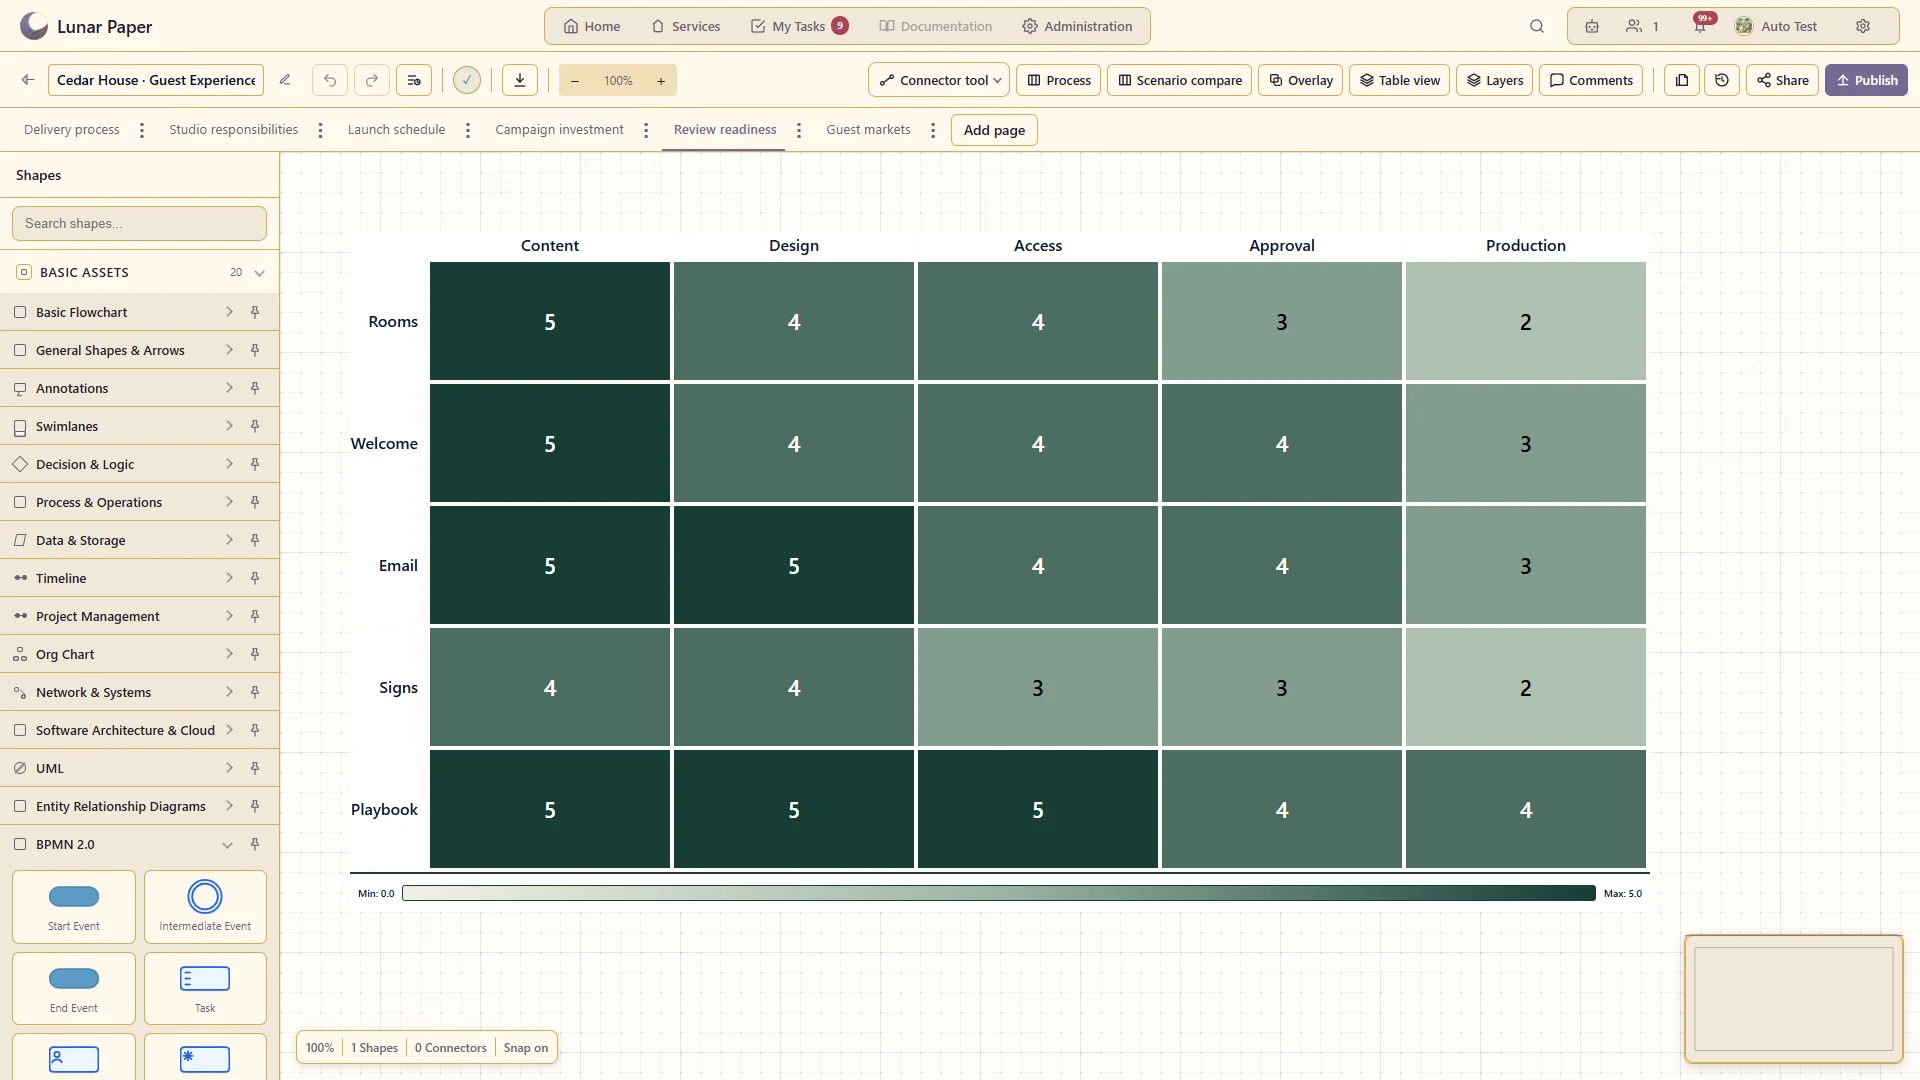
Use supported heatmap and fan-chart shapes for density or range-based information.
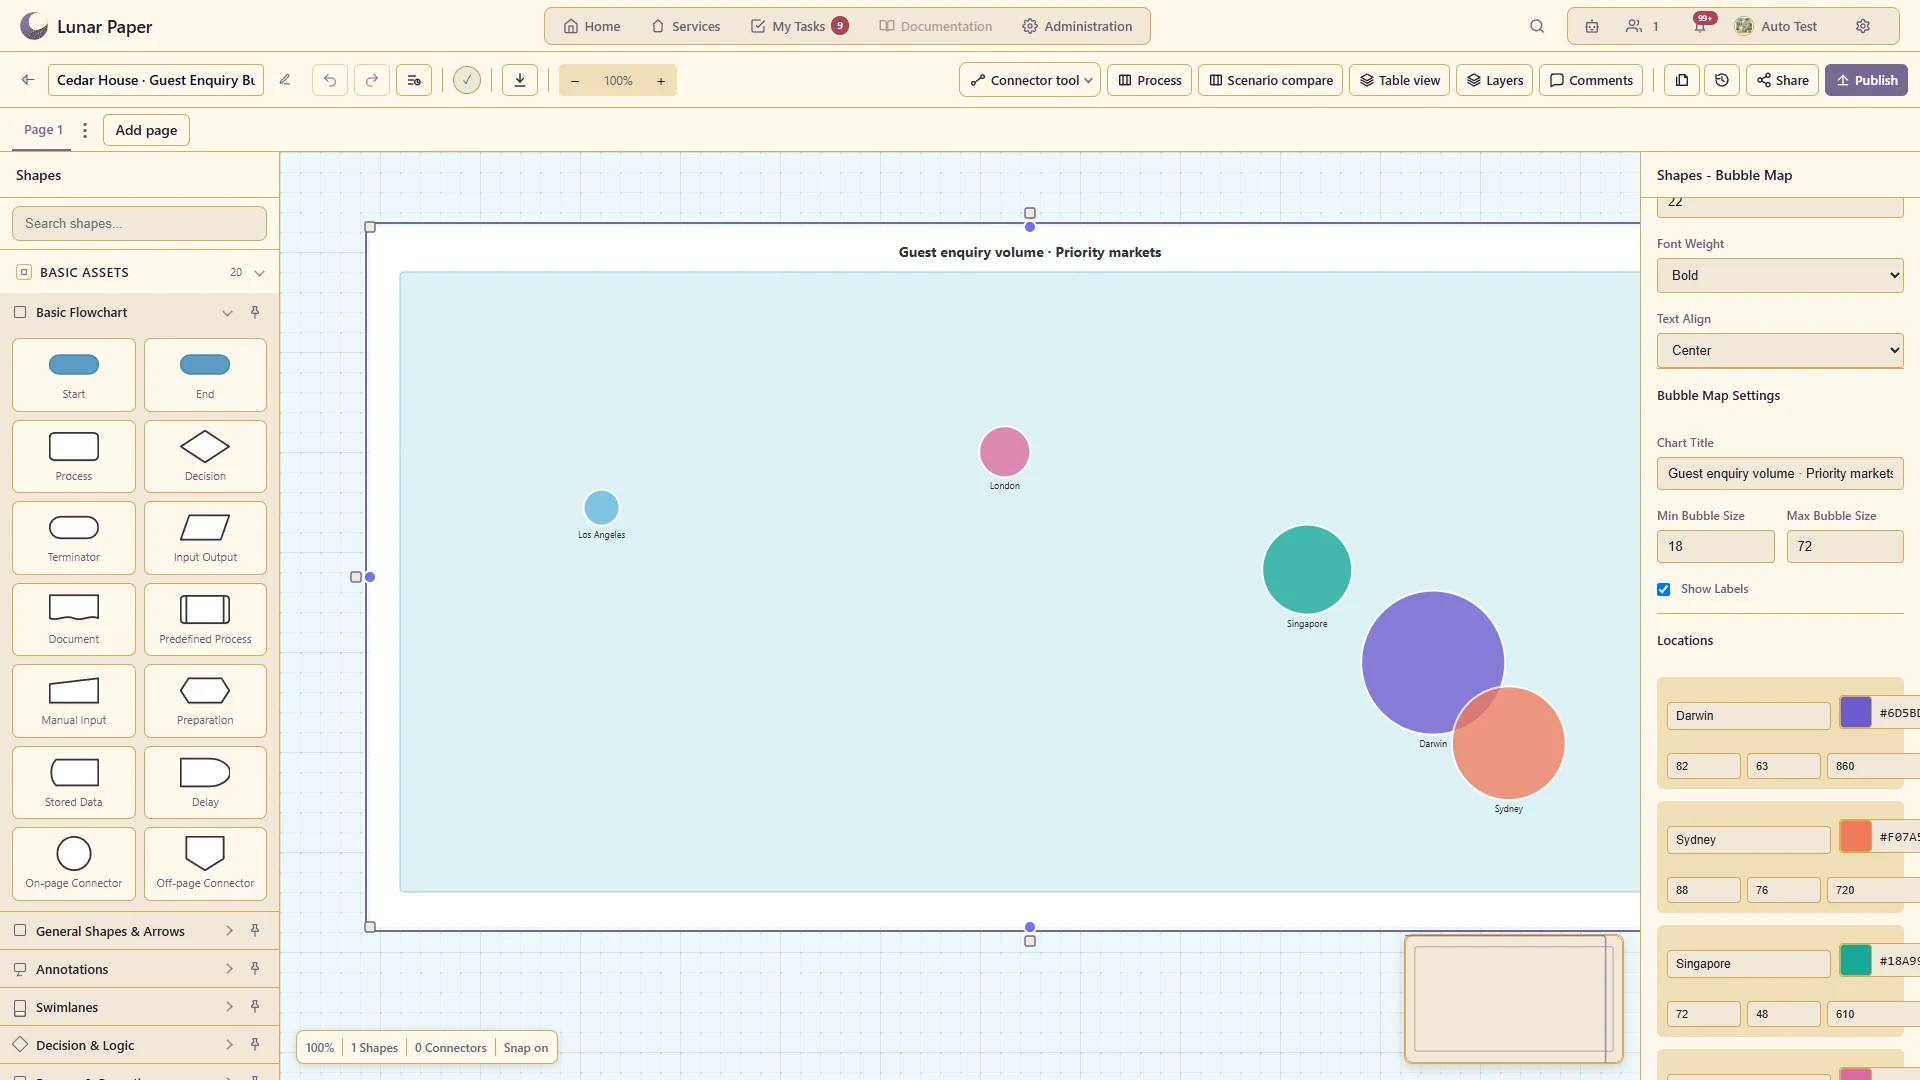
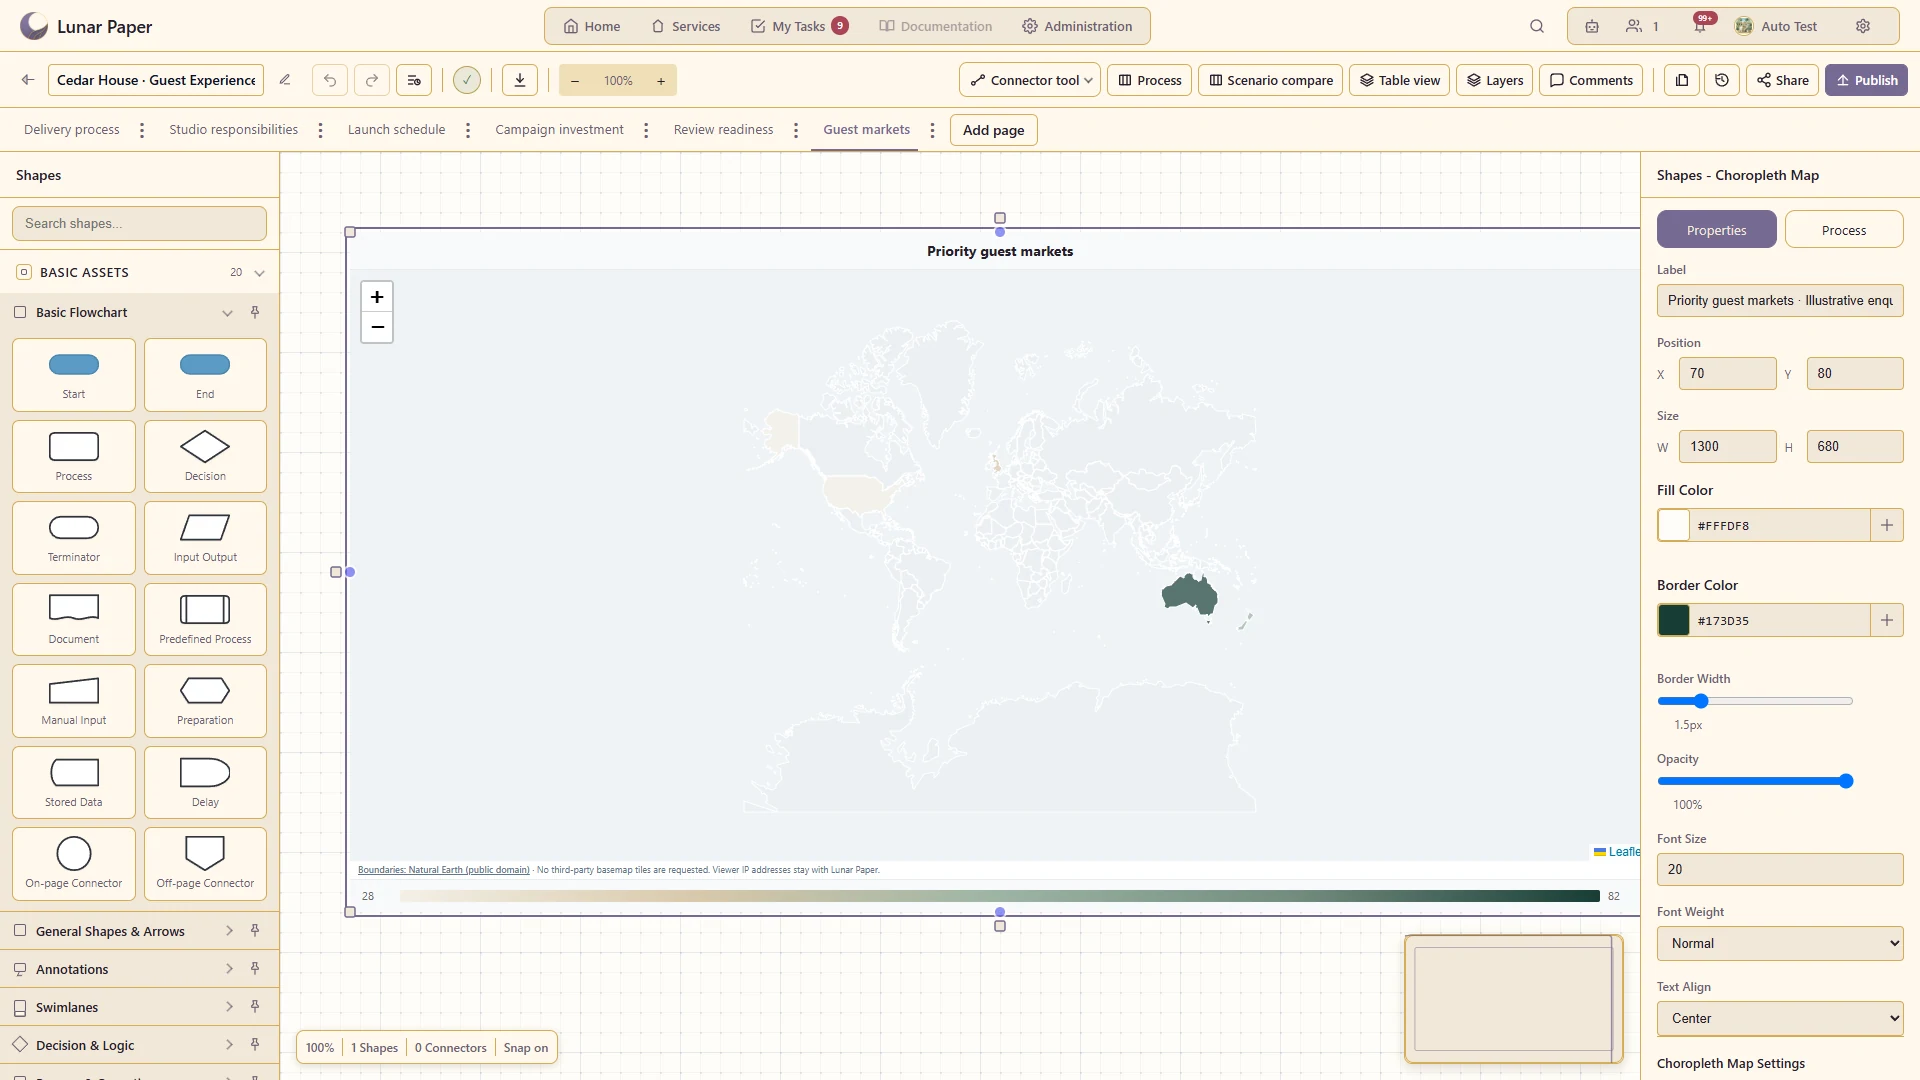
Use the supported geographic chart presets with relevant regional data.
Maintain named rows, columns and values beside the visualisation they drive.
Make direction, branch outcomes and relationships readable.
Organise a complex canvas and control how its elements are grouped.
Inspect process information in rows as well as on the canvas.
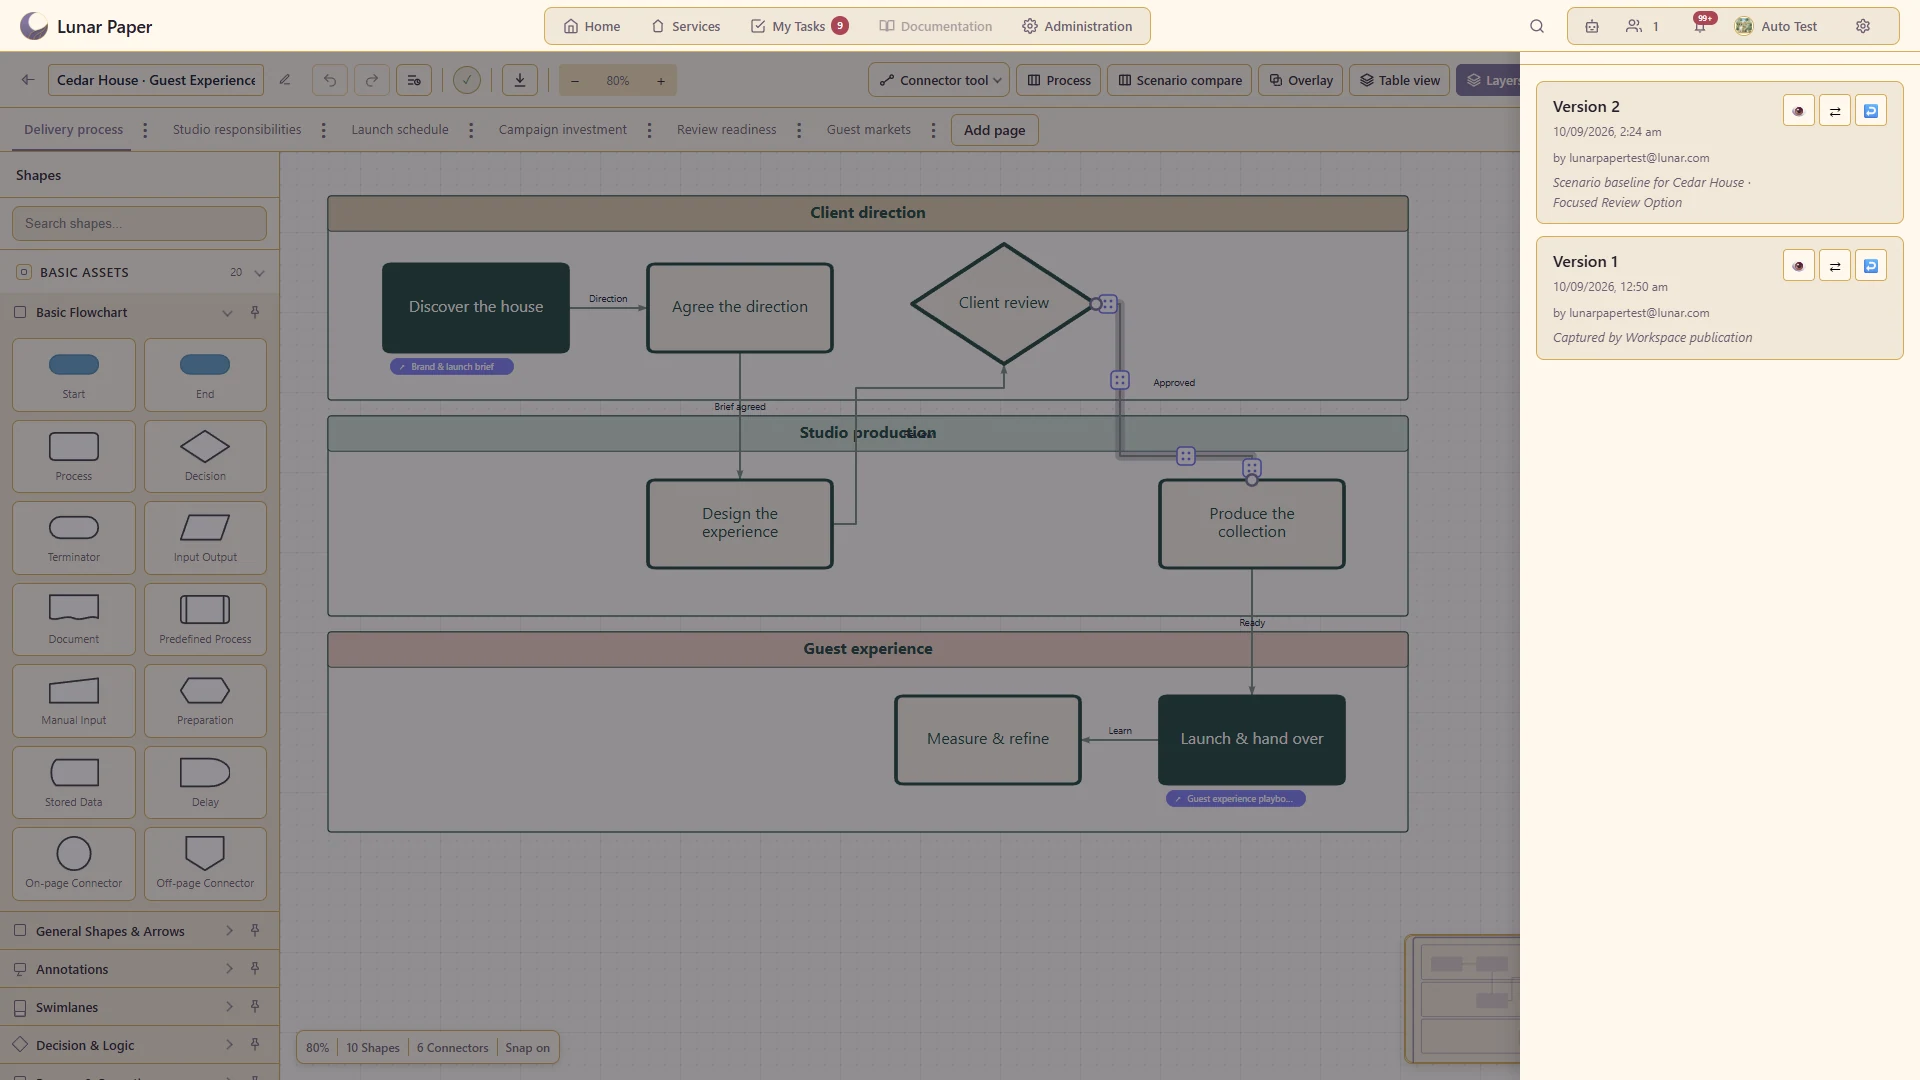
Preserve an agreed diagram and inspect earlier versions as it develops.
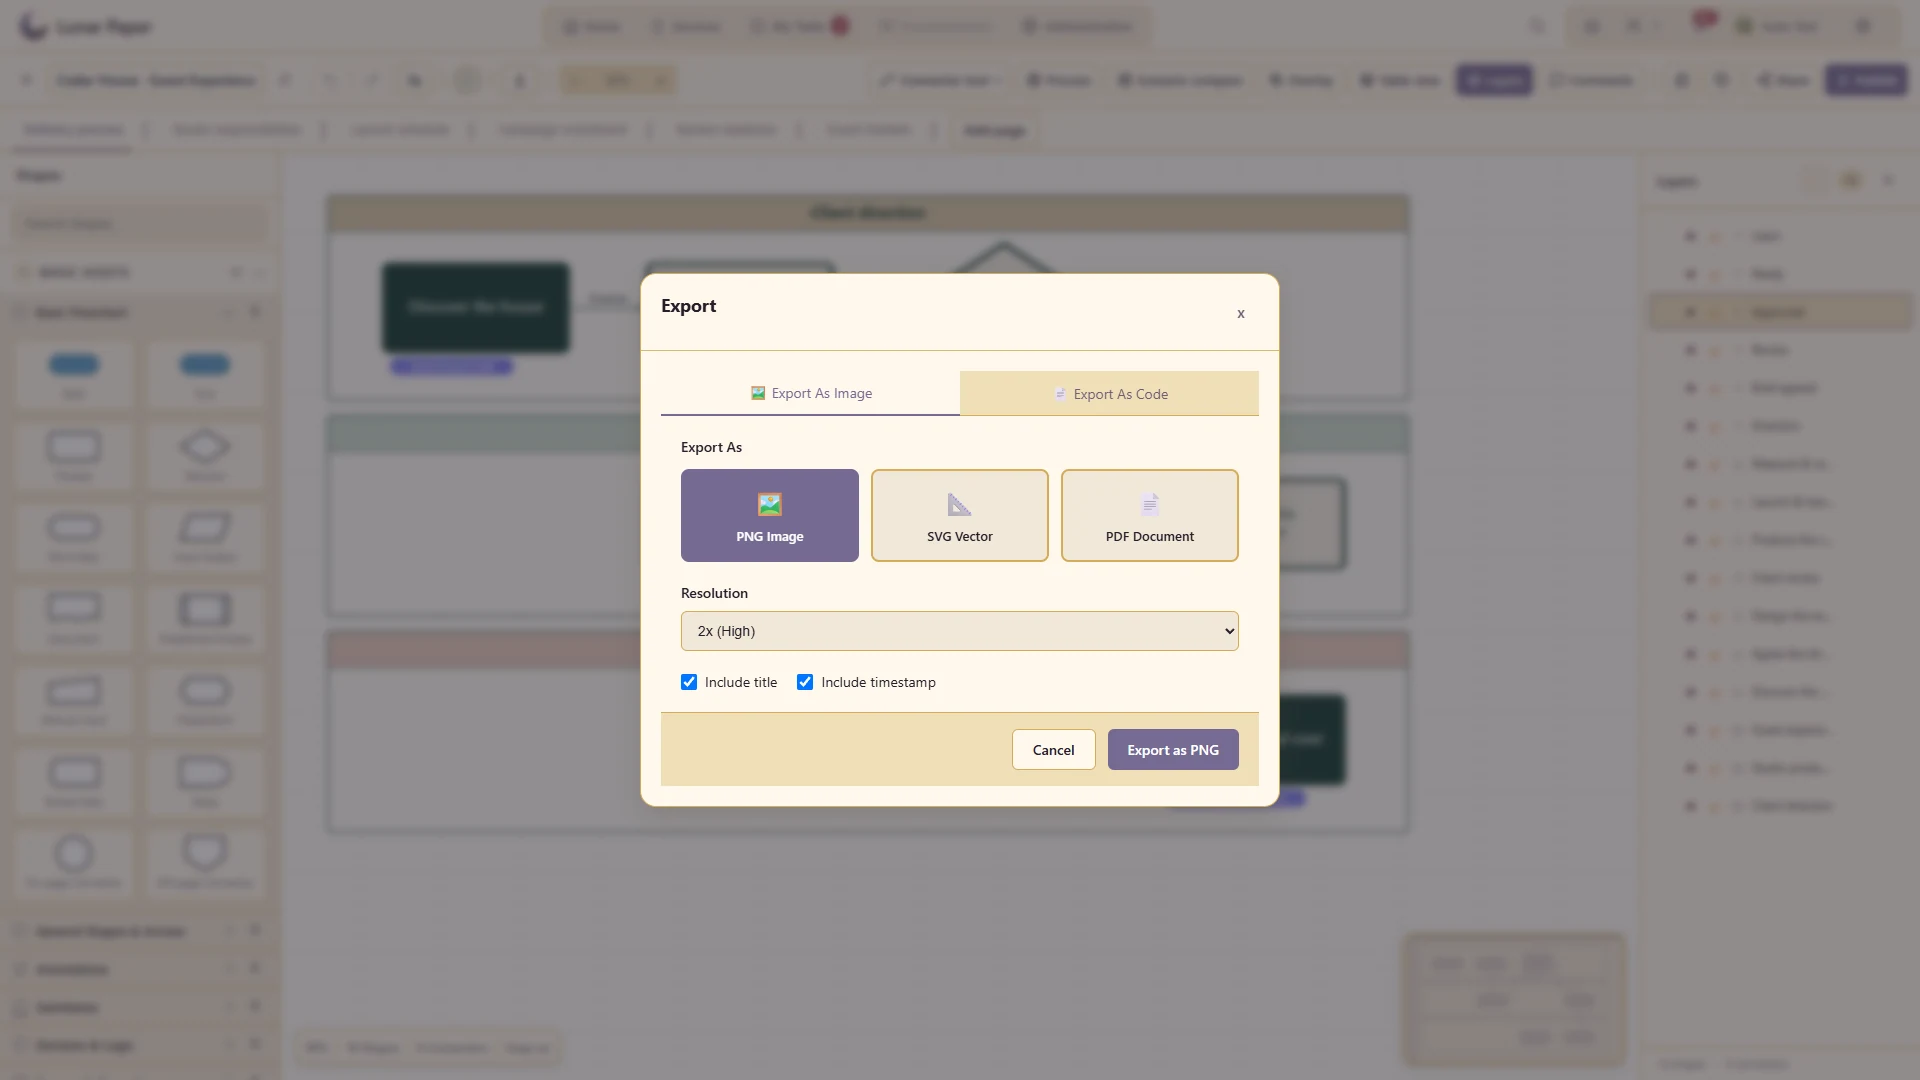
Use the available PNG, SVG, PDF and structured-code export options.
Share an authorised diagram view and work on the source with other contributors.
The main areas Charts and Flowcharts brings together.
Create flowcharts, maps and structured diagrams on a flexible canvas with reusable visual building blocks.
Describe processes, responsibilities and system relationships using specialist diagram types and conventions.
Turn connected or entered data into planning, analytical, geographic and financial visuals.
Add operational meaning to diagrams and examine routes, responsibilities and process alternatives.
Compare options, organise multi-page work and collaborate around changes without losing the visual context.
Save reusable material, share completed visuals and export them for use across the platform and beyond.
Run the platform with all features for free for three people.